The AMD Radeon R7 265 & R7 260 Review: Feat Sapphire & Asus
by Ryan Smith on February 13, 2014 8:00 AM ESTCompute
Jumping into compute, we’re once again treading into familar territory. Pitcairn and Bonaire are Pitcairn and Bonaire, so this will result in the same general performance differences we've seen elsewhere.
As always we'll start with our DirectCompute game example, Civilization V, which uses DirectCompute to decompress textures on the fly. Civ V includes a sub-benchmark that exclusively tests the speed of their texture decompression algorithm by repeatedly decompressing the textures required for one of the game’s leader scenes. While DirectCompute is used in many games, this is one of the only games with a benchmark that can isolate the use of DirectCompute and its resulting performance.
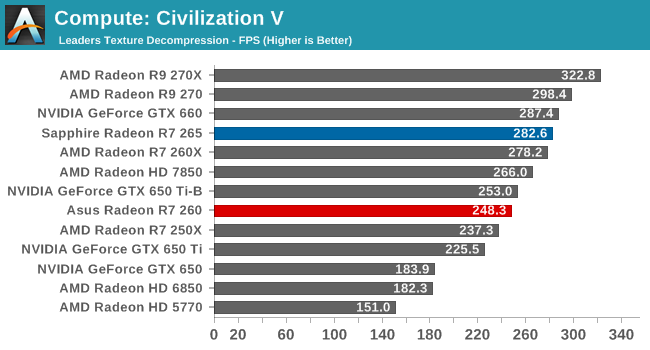
Similar to the 3DMark pixel throughput test on the last page, the Civilization V texture decompression tests highlights the fact that the R7 265 and R7 260X are closer than one would expect in certain edge cases. Once again the R7 260X’s higher clockspeed is helping it keep the gap between it and the R7 265 very narrow, as the two have very similar shader throughput in the end.
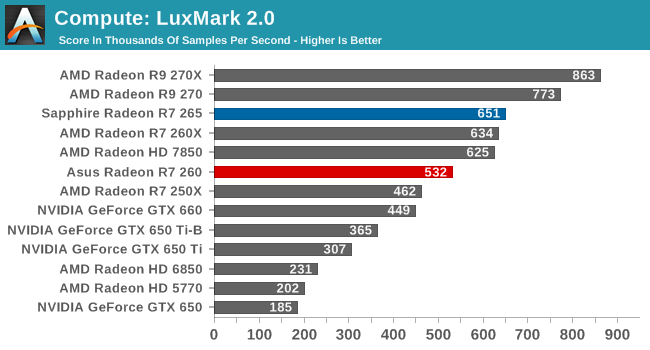
The story is much the same with LuxMark as it was Civilization V, with AMD cards once again being sorted almost exactly by shader throughput. Though it’s worth pointing out that NVIDIA’s performance under LuxMark has greatly improved as of the R334 drivers. It’s not enough to close the gap with AMD, but it’s closer than it once was.
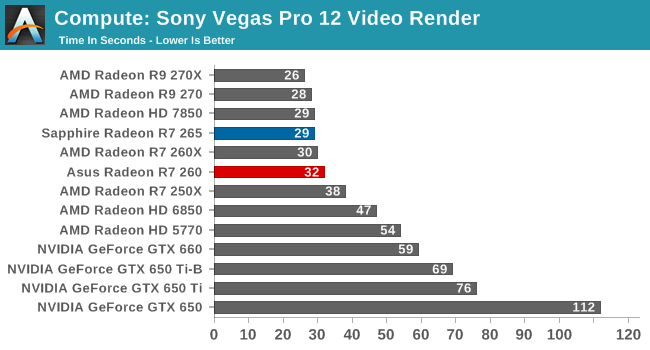
Like LuxMark, Sony Vegas is a benchmark dominated by AMD. The lead here is so great that the R7 265 could run this benchmark twice over before the GTX 660 completed it once. Nor would the R7 260 be too far behind in that respect.
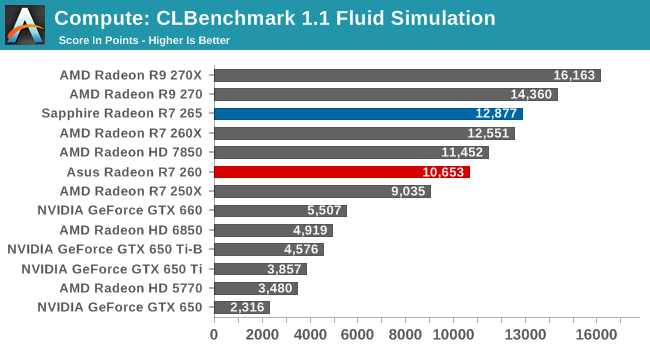
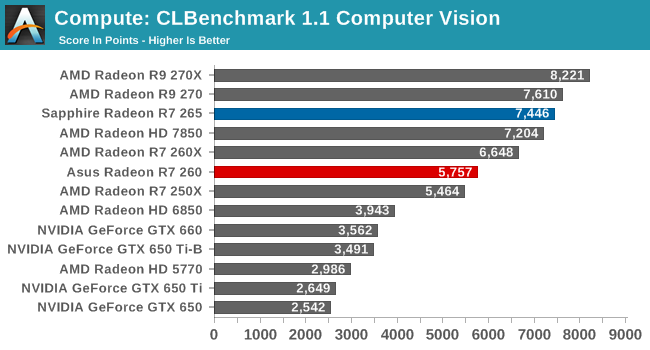
Both CLBenchmark’s fluid simulation benchmark and the computer vision benchmark go to AMD here. The GTX 650 Ti and GTX 660 are not competitive here.
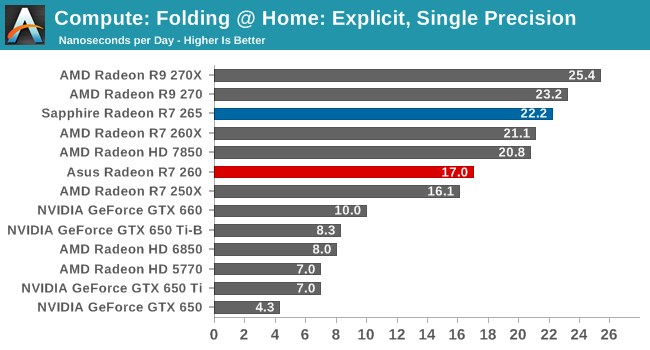
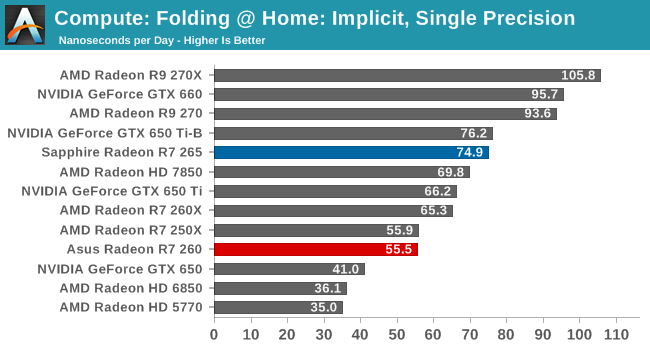
With AMD’s Catalyst 14.1 drivers, AMD has been able to increase their Folding @ Home performance by several percent, closing some gaps while widening others. In the Explicit SP benchmark AMD further increases their lead here, with even the lowly R7 250X holding a significant lead over the GTX 660. On the other hand the R7 265 can’t come close to the GTX 660 under Implicit SP; there’s a lack of raw shader throughput to make it happen.
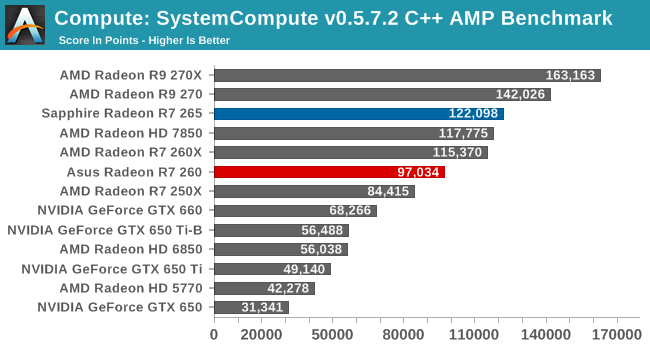
SystemCompute is another compute benchmark that goes to AMD. The R7 265 and R7 260 handily beat the GTX 660, never mind the GTX 650 Ti.


52 Comments
View All Comments
AlucardX - Thursday, February 13, 2014 - link
Since the 7850 was a great overclocker, I wonder how this rebadge product is. Any plans to overclocking with an increased Vcore?Ryan Smith - Thursday, February 13, 2014 - link
Not with this one. I only had 2 days to put this review together, so unfortunately there wasn't time for overclocking.krumme - Thursday, February 13, 2014 - link
Intel Core i7-4960X at 4.2GHz with a 260 playing BF4 single player.Perhaps not the most realistic scenario in this world.
MrSpadge - Thursday, February 13, 2014 - link
It shows you what the card can do. If you're concerned about your CPU limiting you in BF4 multi player.. well, better read a CPU review.krumme - Friday, February 14, 2014 - link
A user playing with the s260 will typically have dual core i3. Thats reality. Try that with or without mantle in Multiplayer 64 man on the big maps. It the difference between playable or not playable. Probably more than 50% difference in favor of mantle. Instaed we get this useless talk.Rebel1080 - Friday, February 14, 2014 - link
What you're getting here is the equivalent of an Xbox One for $119 or PS4 for $149. It took Nvidia and ATI about 12-18 months just to release a video card of equal or better performance for under $199 after the seventh generation's (Xbox 360/PS3) debut. The fact that it only took 3 months to get to this level for under $150 during this generation only shows just how much $ony and M$FT low balled it's customers on specs.silverblue - Friday, February 14, 2014 - link
Except you then have to factor in the rest of the hardware to that price. Think about it - CPU, cooling, motherboard, memory (I don't think 8GB of GDDR5 is cheap), storage, case, power supply, software and the all-important input devices. Add in the fact that developers will get more out of the console GPUs than with the PC and I think you're ragging on them a bit too much.Antronman - Wednesday, February 19, 2014 - link
You mean 4GBs of DDR3. And likely high CAS latency too. Low-watt GPUs. Software only costs how much you pay the employees. Input ports are part of the mobo. DEVs do not get more out of the console GPUs. They are actually underclocked so that you don't need desktop-grade cooling. Consoles will never be serious gaming machines. People who buy consoles either won't spend the money on a good PC, can't spend the money, or would rather spend the money on dozens of games that they'll only play a couple of hours of and then just stick to one game.golemite - Saturday, February 15, 2014 - link
270's inflated prices are directly the result of cryptocoin mining as it has been found to offer an advantageous Kilo-hash to Watt ratio. It would be interesting and helpful to many out there if Anandtech started publishing KH/sec and KH/watt metrics in its review for Scrypt mining.Will Robinson - Monday, February 17, 2014 - link
Nice addition to the AMD lineup.... and a pretty convincing demolition of NVDA's competing cards.Thanx for the review!