OCZ Vertex 460 (240GB) Review
by Kristian Vättö on January 22, 2014 9:00 AM EST- Posted in
- Storage
- SSDs
- OCZ
- Indilinx
- Vertex 460
Random Read/Write Speed
The four corners of SSD performance are as follows: random read, random write, sequential read and sequential write speed. Random accesses are generally small in size, while sequential accesses tend to be larger and thus we have the four Iometer tests we use in all of our reviews.
Our first test writes 4KB in a completely random pattern over an 8GB space of the drive to simulate the sort of random access that you'd see on an OS drive (even this is more stressful than a normal desktop user would see). I perform three concurrent IOs and run the test for 3 minutes. The results reported are in average MB/s over the entire time. We use both standard pseudo randomly generated data for each write as well as fully random data to show you both the maximum and minimum performance offered by SandForce based drives in these tests. The average performance of SF drives will likely be somewhere in between the two values for each drive you see in the graphs. For an understanding of why this matters, read our original SandForce article.
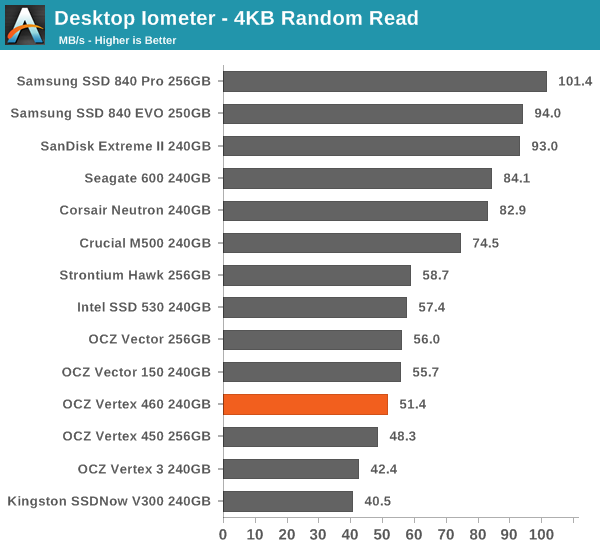
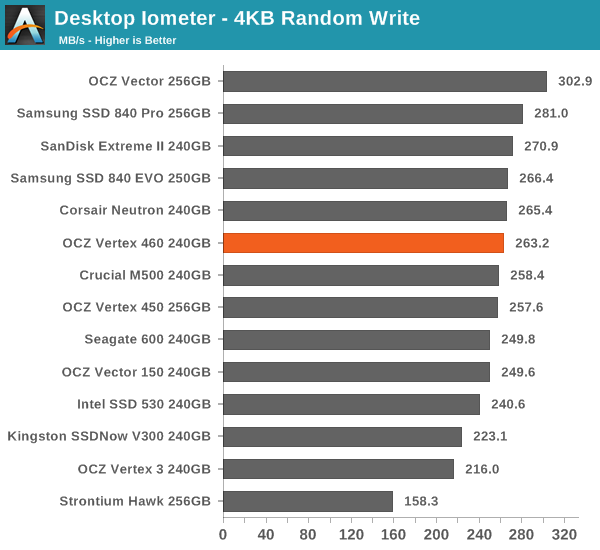
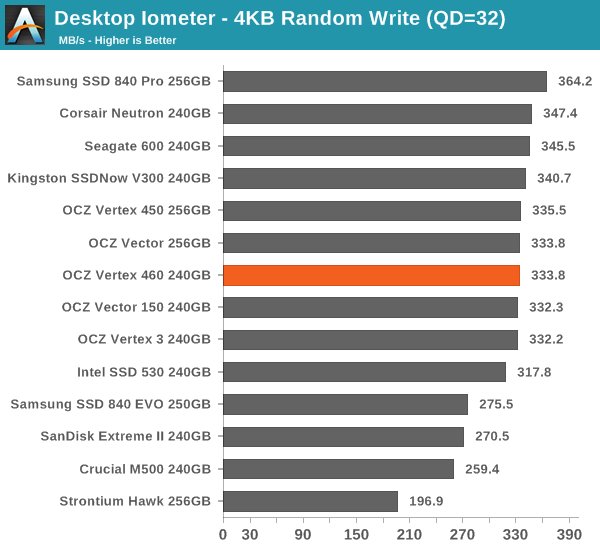
In random read/write tests the Vertex 460 and Vector 150 trade punches but the differences are minor. Our Vector 150 sample was tested a few months back so minor differences in firmware could account for the increased random read/write results, or it may simply be margin of error.
Sequential Read/Write Speed
To measure sequential performance I ran a 1 minute long 128KB sequential test over the entire span of the drive at a queue depth of 1. The results reported are in average MB/s over the entire test length.
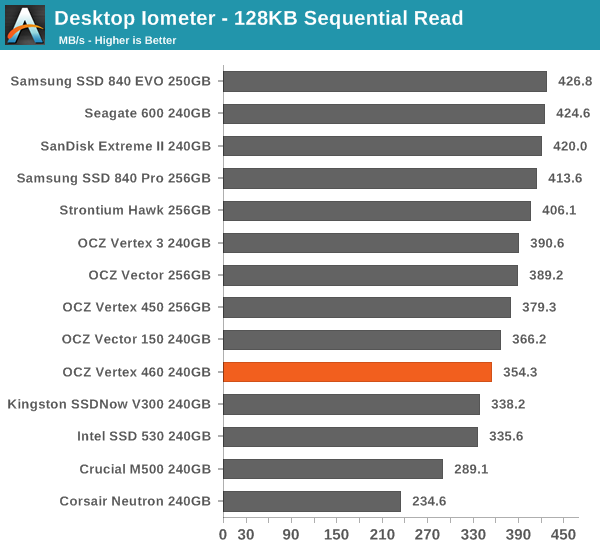
Same goes for sequential performance: the Vertex 460 and Vector 150 perform more or less equally.
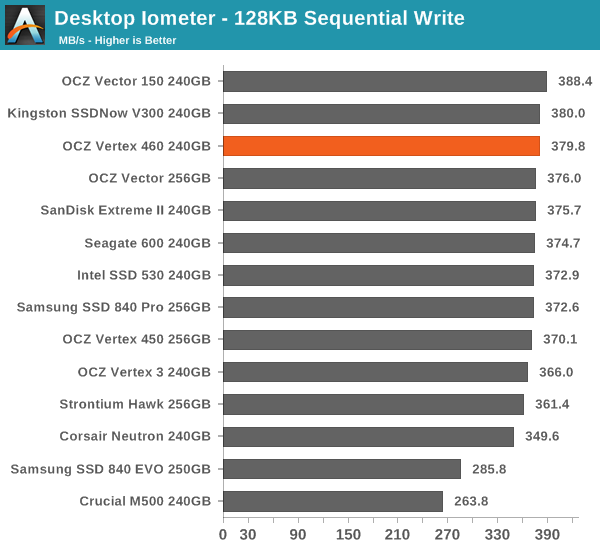
Sequential performance gives the Vector 150 a slight edge in both read and write results, but the difference is only a few percent at most.
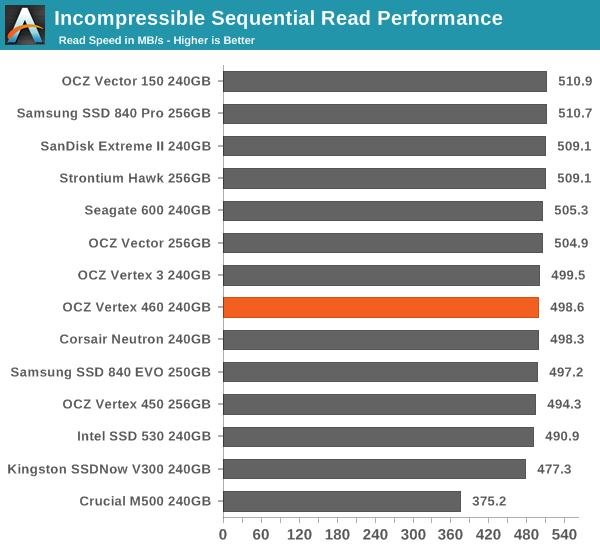
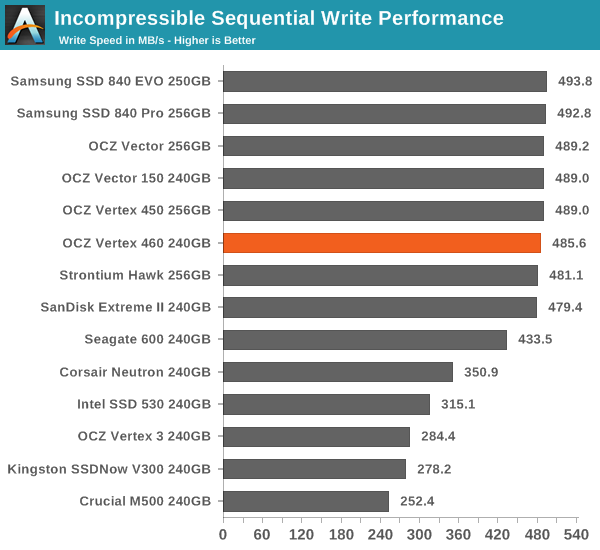
AS-SSD Incompressible Sequential Read/Write Performance
The AS-SSD sequential benchmark uses incompressible data for all of its transfers. The result is a pretty big reduction in sequential write speed on SandForce based controllers.


69 Comments
View All Comments
Kristian Vättö - Friday, January 24, 2014 - link
Thanks, fixed!Per Hansson - Thursday, January 23, 2014 - link
It's mind boggling why Toshiba would like to keep the name OCZ.I actually thought OCZ had improved since the debacles of the old Vertex drives, but then I found this:
http://www.hardware.fr/articles/893-7/ssd.html
http://www.hardware.fr/articles/911-7/ssd.html
40 > 50% failure rate on the Petrol & Octane series SSD's
10% on Agility 4
And then even more troubling from the following article:
OCZ Vector with 9 to 11% failure rate
No thank you
dbwells - Thursday, January 23, 2014 - link
Was the SanDisk Extreme II 480GB really only $300 two days ago? Showing $450 at the moment :(FalcomPSX - Thursday, January 23, 2014 - link
you couldn't pay me to use an OCZ product again. i've lost 4 vertex 2 ssd's due to random failures, and although they covered it under warranty each time(yes i bought one drive, died 4 times) its not worth the hassle or risk of data loss, especially when that risk of data loss isn't a question of IF it will fail, but only a question of WHEN it will fail.mattgmann - Thursday, January 23, 2014 - link
I'd love to see some SSD comparison/ranking charts. There's such a wide variety of makes/controllers out there these days that it's getting too hard to keep track of the best performance/dollar, reliability/dollar or best drive/specific use.Plus, we all like rankings...right?
arehaas - Sunday, January 26, 2014 - link
Why does the clear Storage Bench champion according to this page, 840 EVO mSATA, have 322.9 MB/s data rate on this page but only 261.5MB/s on its own review page on Jan 9, 2014??Kristian Vättö - Sunday, January 26, 2014 - link
When I first generated the graphs, our Bench had the old value (322.9MB/s) in it. I manually updated the graph with the newer and more reasonable 261.5MB/s result but for some reason the actual graph wasn't updated. It's fixed now!arehaas - Sunday, January 26, 2014 - link
Thank you for the quick reply. It will help me to select components for upgrading my laptop.jeff420 - Thursday, January 28, 2016 - link
These is a beast. I have this for awhile now and can't complain.Jeff @ http://www.audiospeakerworld.com