AMD Kaveri Review: A8-7600 and A10-7850K Tested
by Ian Cutress & Rahul Garg on January 14, 2014 8:00 AM ESTCPU Performance
I often make a big song and dance about real world benchmarks being the main focus of a reviewer. Synthetics often stress parts of the CPU and distort advantages that a CPU might have and thus not affect you or me in the same manner when using the machine normally. For 2014 I have updated my usual benchmarking set, to include more video encoding and an image converter that takes 2D images and performs algorithms to convert the data into a 3D model. Some 2013 benchmarks are still here, showing what can be done, and to bring parity to previous CPU reviews, some synthetics are also included.
Agisoft Photoscan v1.0 - link
Our new main benchmark to AnandTech is provided by Agisoft. Their Photoscan software creates 3D models from 2D images, a process which is very computationally expensive. The algorithm is split into four distinct phases, and different phases of the model reconstruction require either fast memory, fast IPC, more cores, or even OpenCL compute devices to hand. Agisoft supplied us with a special version of the software to script the process, where we take 50 images of a stately home and convert it into a medium quality model. This benchmark typically takes around 15-20 minutes on a high end PC on the CPU alone, with GPUs reducing the time.
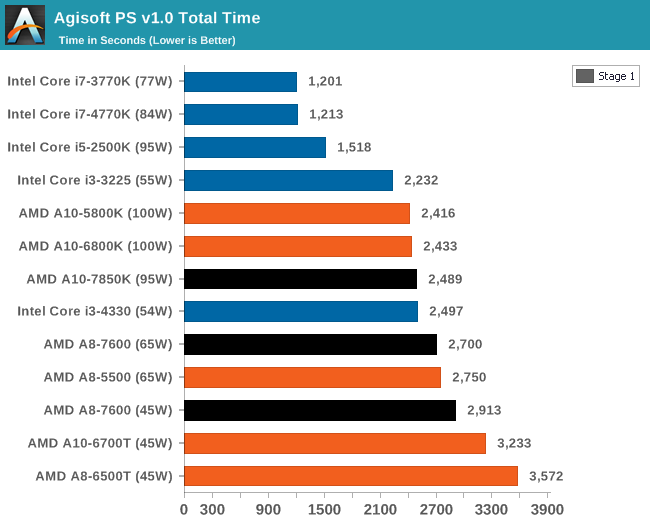
AMD suffers in overall time due to the lack of full-blooded cores and the reliance on single threaded performance in certain parts of the algorithm.
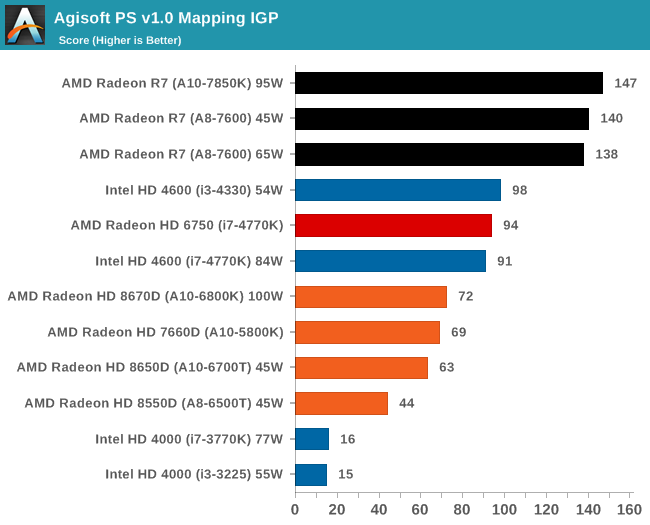
The second stage of the benchmark can be accelerated by the IGP of an APU, and as a result we can see the power of the high end APUs for this work can outshine any CPU we tested today. This is really the promise of HSA, it's just going to take a while to get there for most apps.
3D Particle Movement - link
3DPM is a self-penned benchmark, taking basic 3D movement algorithms used in Brownian Motion simulations and testing them for speed. High floating point performance, MHz and IPC wins in the single thread version, whereas the multithread version has to handle the threads and loves more cores.
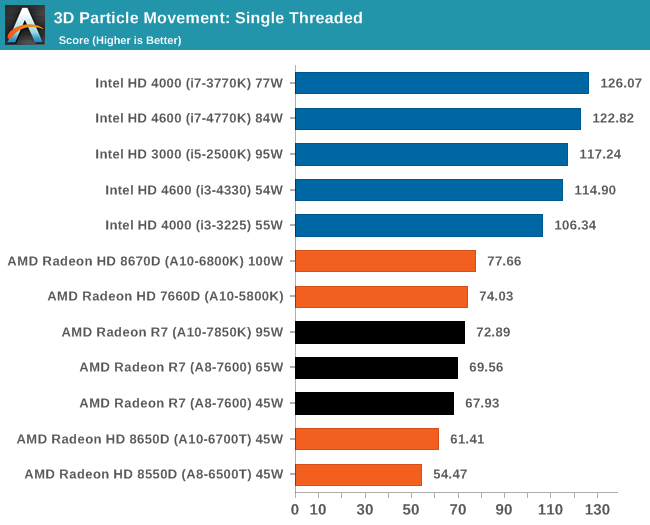
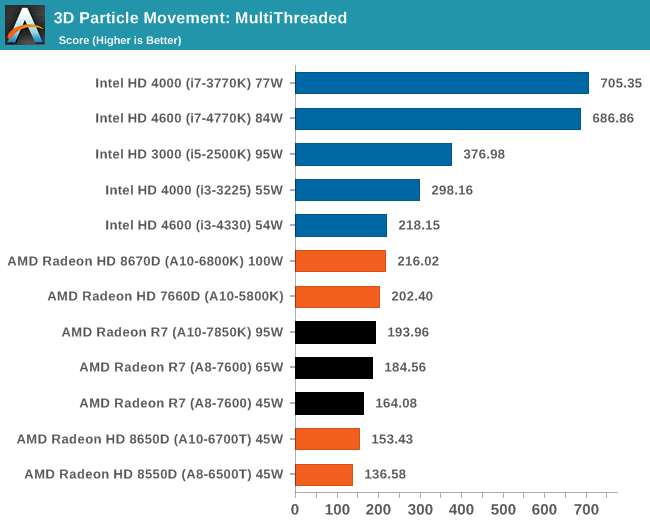
AMD is still suffering a lack of FP performance in our 3DPM benchmark.
WinRAR 5.01 - link
Our WinRAR test from 2013 is updated to the latest version of WinRAR at the start of 2014. We compress a set of 2867 files across 320 folders totaling 1.52 GB in size – 95% of these files are small typical website files, and the rest (90% of the size) are small 30 second 720p videos.
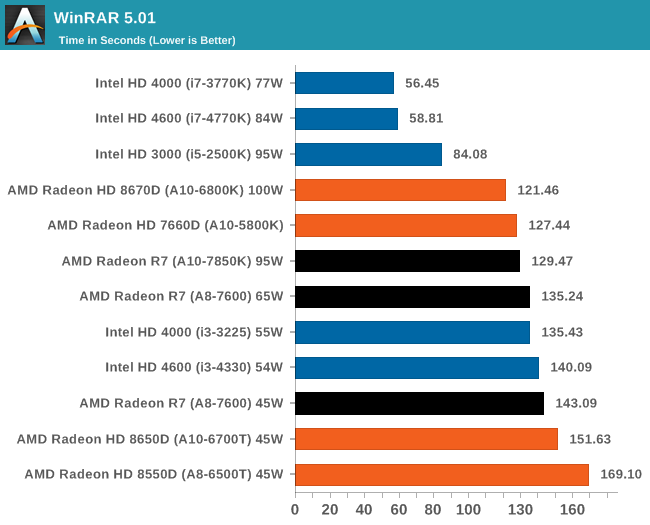
WinRAR loves IPC from the high end Intel chips, but even against the older i5-2500K there is still a deficit. The 45W Kaveri APU however is within fighting distance of its main rival.
FastStone Image Viewer 4.9 - link
Similarly to WinRAR, the FastStone test us updated for 2014 to the latest version. FastStone is the program I use to perform quick or bulk actions on images, such as resizing, adjusting for color and cropping. In our test we take a series of 170 images in various sizes and formats and convert them all into 640x480 .gif files, maintaining the aspect ratio. FastStone does not use multithreading for this test, and thus single threaded performance is often the winner.
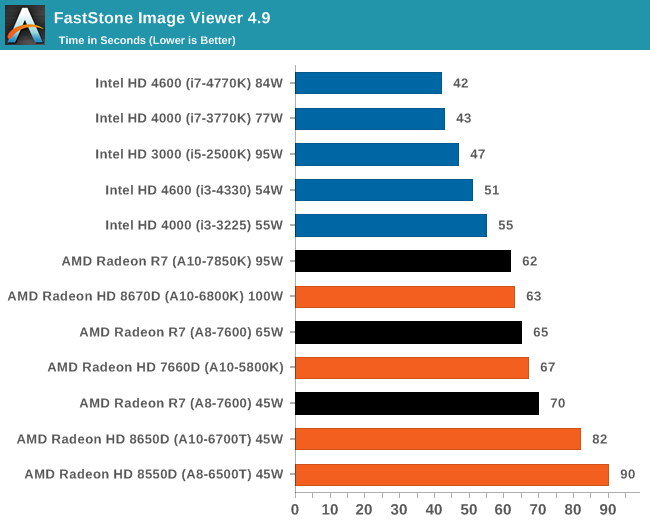
FastStone wants single threaded performance, so Intel wins here again.


380 Comments
View All Comments
jjj - Tuesday, January 14, 2014 - link
lol now that AMD is paying you,you jumped at the other extreme , what do you get over Richland and how does that deserve a positive conclusion? (and maybe a reminder is needed A10-6800K is 140$)Drumsticks - Tuesday, January 14, 2014 - link
The author recognized that 100W TDP isn't really any different...? The 45W more mainstream range is where things are a lot more interesting, but please, ignore the 30+% gains.Conduit - Tuesday, January 14, 2014 - link
I have been waiting almost 2 years for a mobile Kaveri telling myself the wait will be worth it. Looks like it actually may be as Kaveri performs better at lower TDP's than Trinity and Richland.Hubb1e - Tuesday, January 14, 2014 - link
This guy actually gets it. These should make very nice cheap laptops able to actually play a game or two without vomiting all over themselves. At 95W the gains are not there, but at 45W it's impressiveJDG1980 - Tuesday, January 14, 2014 - link
What an odd choice of benchmarks. Why not use Photoshop (which supports OpenCL and is an important real-world application) instead of Agisoft (who?) I can't help but wonder if Agisoft paid for their inclusion in Anandtech's benchmark suite.ddriver - Tuesday, January 14, 2014 - link
You may notice that the entire review is not exactly OpenCL compute rich... I mean even for gaming cards AT usually includes several OpenCL benchmarks, but not for this product, where it is supposed to be its strongest point???Conduit - Tuesday, January 14, 2014 - link
I have to say, the 45W A8-7600 kicks ass. It's competitive with the 100W A10-5800K, I think that's where the benefit of Kaveri lies, in the low TDP department.UtilityMax - Tuesday, January 14, 2014 - link
Indeed. However, I personally would like to see benchmarks that measure the power draw. The 65watt TDP Richland A10s were nearly as power thirsty as the +100watt TDP parts. A8 does look interesting.thegreatjombi - Tuesday, January 14, 2014 - link
Any chance we can get HD5200 and HD5400 benches? The 5000 series has started to catch up with AMD in terms of GPU Compute. I am curious if AMD has left Intel in the dust once again, or has Intel actually made a big enough leap to stay in the game.thegreatjombi - Tuesday, January 14, 2014 - link
Oh! It seems the 5000 series is just omitted in the CPU Performance benchmarks? Why is that?