Samsung SSD 840 EVO mSATA (120GB, 250GB, 500GB & 1TB) Review
by Kristian Vättö on January 9, 2014 1:35 PM ESTAnandTech Storage Bench 2011
Two years ago we introduced our AnandTech Storage Bench, a suite of benchmarks that took traces of real OS/application usage and played them back in a repeatable manner. Anand assembled the traces out of frustration with the majority of what we have today in terms of SSD benchmarks.
Although the AnandTech Storage Bench tests did a good job of characterizing SSD performance, they weren't stressful enough. All of the tests performed less than 10GB of reads/writes and typically involved only 4GB of writes specifically. That's not even enough exceed the spare area on most SSDs. Most canned SSD benchmarks don't even come close to writing a single gigabyte of data, but that doesn't mean that simply writing 4GB is acceptable.
Originally the benchmarks were kept short enough that they wouldn't be a burden to run (~30 minutes) but long enough that they were representative of what a power user might do with their system.
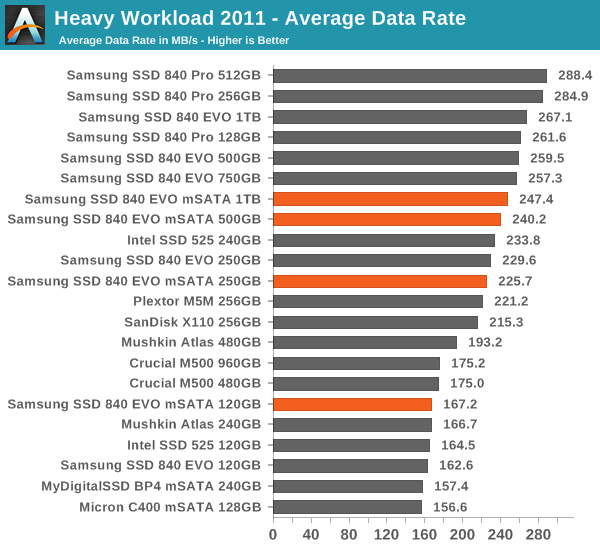
1) The MOASB, officially called AnandTech Storage Bench 2011 - Heavy Workload, mainly focuses on the times when your I/O activity is the highest. There is a lot of downloading and application installing that happens during the course of this test. Our thinking was that it's during application installs, file copies, downloading and multitasking with all of this that you can really notice performance differences between drives.
2) We tried to cover as many bases as possible with the software incorporated into this test. There's a lot of photo editing in Photoshop, HTML editing in Dreamweaver, web browsing, game playing/level loading (Starcraft II & WoW are both a part of the test) as well as general use stuff (application installing, virus scanning). We've included a large amount of email downloading, document creation and editing as well. To top it all off we even use Visual Studio 2008 to build Chromium during the test.
The test has 2,168,893 read operations and 1,783,447 write operations. The IO breakdown is as follows:
| AnandTech Storage Bench 2011 - Heavy Workload IO Breakdown | ||||
| IO Size | % of Total | |||
| 4KB | 28% | |||
| 16KB | 10% | |||
| 32KB | 10% | |||
| 64KB | 4% | |||
Only 42% of all operations are sequential, the rest range from pseudo to fully random (with most falling in the pseudo-random category). Average queue depth is 4.625 IOs, with 59% of operations taking place in an IO queue of 1.
AnandTech Storage Bench 2011 - Heavy Workload
The full data set including disk busy times and read/write separation can be found in our Bench.
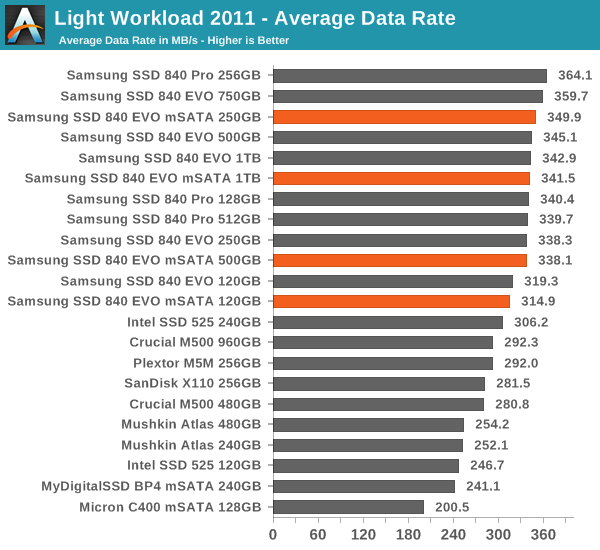
AnandTech Storage Bench 2011 - Light Workload
Our light workload actually has more write operations than read operations. The split is as follows: 372,630 reads and 459,709 writes. The relatively close read/write ratio does better mimic a typical light workload (although even lighter workloads would be far more read centric). There's lots of web browsing, photo editing (but with a greater focus on photo consumption), video playback as well as some application installs and gaming.
The I/O breakdown is similar to the heavy workload at small IOs, however you'll notice that there are far fewer large IO transfers. Interestingly, the 480GB drive actually comes out ahead in this case, suggesting it's more capable at light workloads.
| AnandTech Storage Bench 2011 - Light Workload IO Breakdown | ||||
| IO Size | % of Total | |||
| 4KB | 27% | |||
| 16KB | 8% | |||
| 32KB | 6% | |||
| 64KB | 5% | |||


65 Comments
View All Comments
Chubblez - Thursday, January 9, 2014 - link
I have 8 5 shelf SAN's (EMC AX4-5f) all full of 1 and 2TB drives that would disagree with you.I also have 4 256G EVO's that get hammered pretty hard in an HP server, but I can't speak to the very long term effects. Initial data tells me your wrong on that as well.
Death666Angel - Sunday, January 12, 2014 - link
I have 8 2TB drives since October 2011 running in 2 RAID 5 in my file server (consumer grade Samsung, WD, Hitachi). I have 2 1TB 2.5" drives running since 2 years in my desktop. I have a 1TB and a 1.5TB 3.5" drive for well over 4 years in external enclosures. Not one failed. So let's pit anecdotal evidence against anecdotal evidence, shall we?dgingeri - Thursday, January 9, 2014 - link
I'd like to see Samsung put out a 500Gb or 1TB SSD with a m.2 PCIe connection. That with an adapter for two m.2 PCIe drives on a PCIe x4 card would make my year. I'd finally be able to get all the drives out of my system and bring it down to just motherboard, cards, H100, and power supply.romrunning - Thursday, January 9, 2014 - link
Why does the Samsung 840 Pro score really badly in the "Destroyer" tests, but are at the top of pretty much every other benchmark shown here?Kristian Vättö - Thursday, January 9, 2014 - link
Because it only has 7% OP by default, whereas most drives have 12% nowadays. In steady-state even small differences in OP can play a major role.blanarahul - Thursday, January 9, 2014 - link
Do you think it would be beneficial to 'not' have Turbowrite at or above 500 GB and focus more on parallism?? I ask this because a 250 GB 840 Evo achieves about 260 MB/s after it runs out of TW cache. So I would expect the 500 GB or above Evo to atleast reach 500 MB/s.Solid State Brain - Friday, January 10, 2014 - link
Question: do Samsung 840 EVO SSDs have less OP than the previous 840 ones, since a percentage of the reserved space is now used for the fixed SLC cache area/TurboWrite?With trim enabled, that should not be a problem (as it makes the drive have "dynamic OP" with free space), but under intense workloads it might, if it's the case.
Kristian Vättö - Friday, January 10, 2014 - link
Technically yes. The 840 actually has slightly better IO consistency, which the higher OP explains.https://dl.dropboxusercontent.com/u/128928769/IO%2...
(The title reads Intel DC S3700 but that's because I use it's graph as a basis of other graphs to guarantee that they're all the same size)
romrunning - Friday, January 10, 2014 - link
That's interesting. I guess that means if you manually over-provision the 840 Pro, then it should dominate the Destroyer benchmark as well. It would be nice to test that scenario out.Kristian Vättö - Friday, January 10, 2014 - link
Due to the nature of the Destroyer, it's unfortunately not possible to assign the test for a certain LBA range (i.e. add OP).