Smartphone Audio Quality Testing
by Chris Heinonen on December 8, 2013 5:15 PM EST- Posted in
- Smartphones
- Audio
- Mobile
- Tablets
- Testing
THD+N is a measure of the total harmonic distortion and noise compared to the signal. The lower the number, the less distortion and noise there is relative to the fundamental frequency. THD+N is measured by driving a 1 kHz sine wave at maximum volume. Because there is always some inherent background noise, the THD+N is almost always lowest at maximum output so that is used for the measurement.
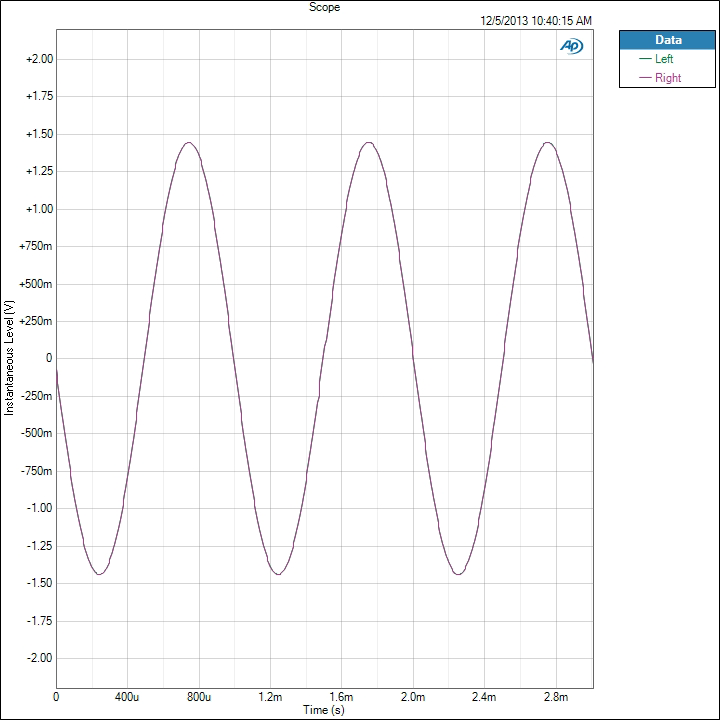
There are two results that we take from this: a sine wave and a FFT spectrum. On the sine wave both channels should line up perfectly, and it should be as close to an accurate sine wave as possible. On the FFT we want to see a peak at 1 kHz and everything else as low as possible. The most common artifact you will see are harmonic sidebands at multiples of 1 kHz.
For an example of data that looks good, here is the sine wave of the iPhone 5. We see a sine wave that is good, with channels that overlap perfectly and no deviation. This is what we expect to see.
Now for a different example we look at the Nexus 5. Run at maximum volume we see that the left channel is clipping in the sine wave. Likely the power to the headphone amplifier is not enough to drive both channels and so this is the result. UPDATE: Tested this with 4.4.1 and no change.
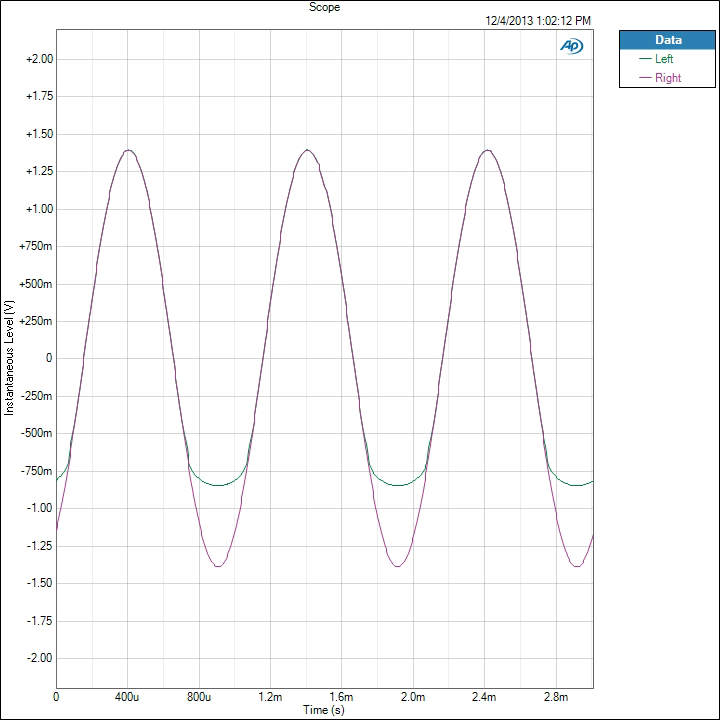
The iPhone 5 produces a THD+N ratio of 0.003134% while because of the clipping, the Nexus 5 is producing 13.789197%. Any level over 1% is considered to be past the clipping point of an amplifier and it seems that the Nexus 5 cannot be driven at maximum volume. I tested two samples to verify, and on both the performance is identical.
Now if we look at the FFT for this test, we see how this distortion is showing up. First, the iPhone 5 is very quiet.
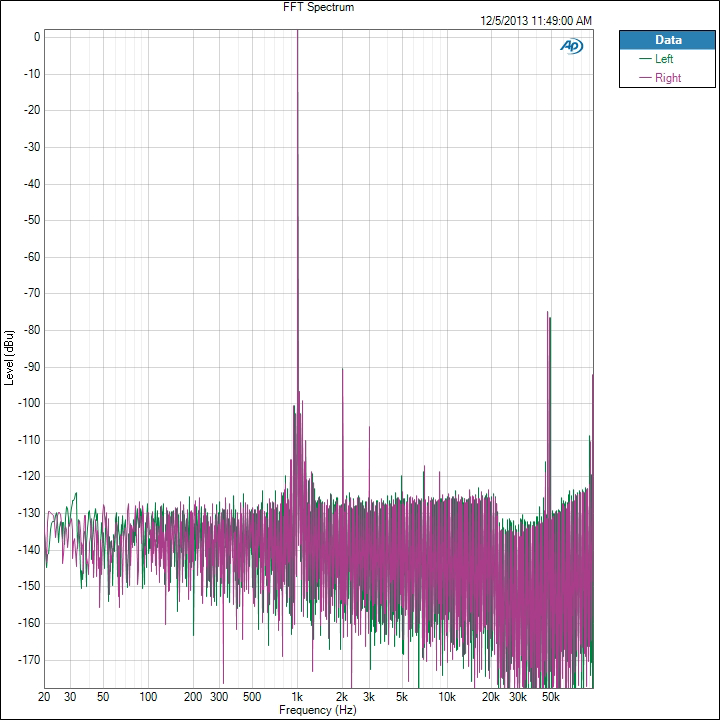
There is a 2 kHz peak that is -93 dB below the fundamental frequency, and the 3rd harmonic at 3 kHz is over -109 dB below it. All the harmonics past that are at -120 dB below the fundamental tone. There is some noise out at 50 kHz but this is so far past the level of human hearing that it is safely ignored. Now the Nexus 5 FFT.
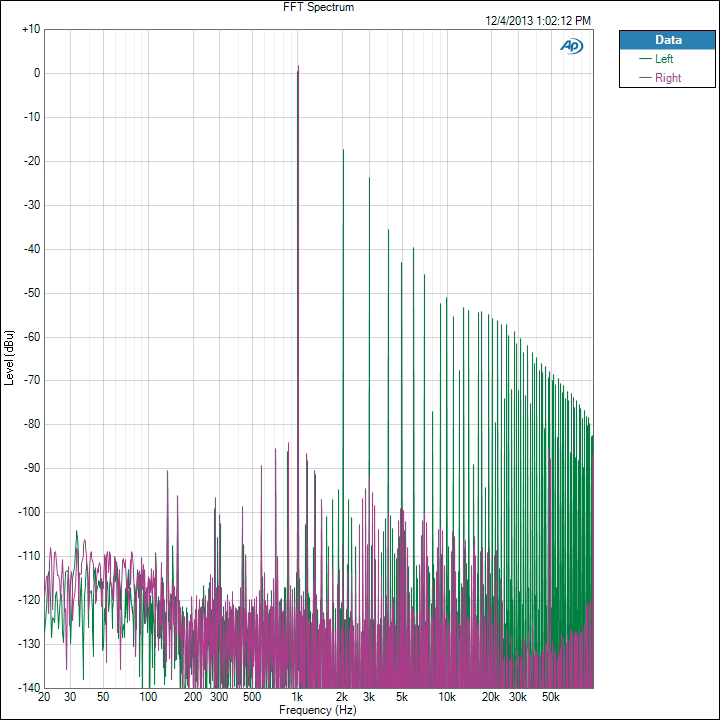
We see the right channel, which didn’t clip, looks good. The 2nd harmonic is -111 dB and the 3rd harmonic is -93 dB. On the left channel the 2nd harmonic is only -18 dB and the 3rd harmonic is -24 dB. Even at the 9th harmonic we are still only -52 dB below the fundamental tone. This is causing these incredibly high THD+N numbers that we are seeing on the Nexus 5. We will see more detail of this on a later test as well.
We also chart THD+N vs. Frequency. Here is the chart for the Note 3.
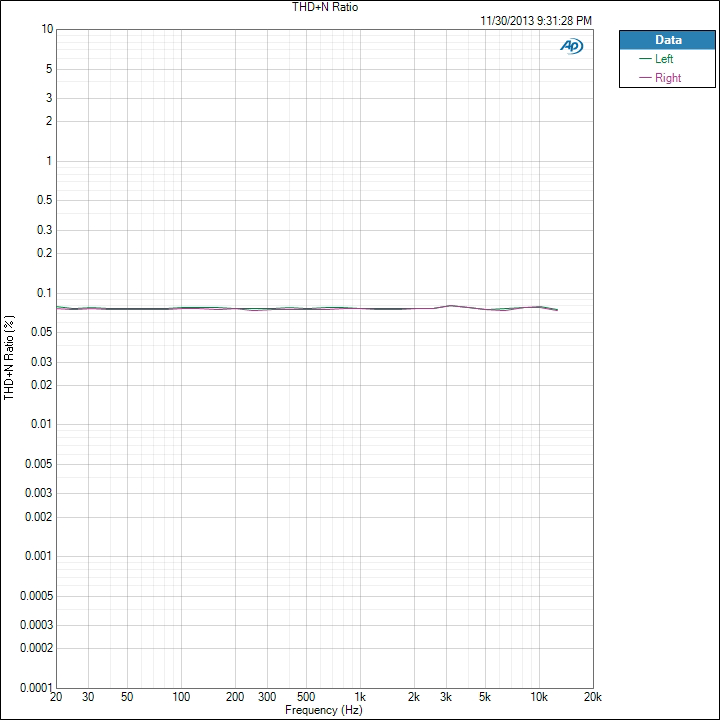
We see that THD+N is basically right below 0.08% for the whole spectrum. It moves up and down slightly, but is very constant. Now here is that Nexus 5 data.
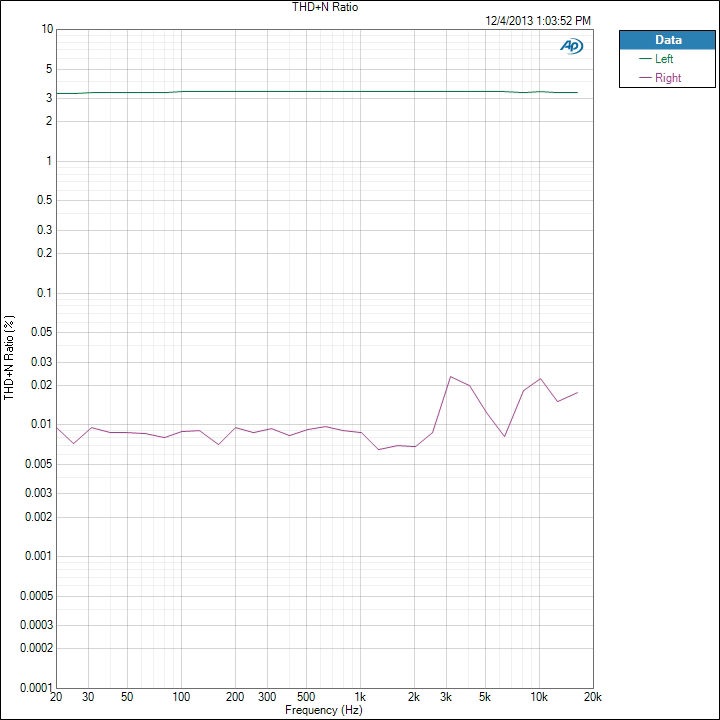
We see that the right channel is around 0.01% THD+N while the left channel, the clipped one, is over 3%. If we ran the Nexus 5 at a lower volume level we would see totally different results, as you’ll find out later, but this is how devices are typically measured.


188 Comments
View All Comments
Origin64 - Monday, December 9, 2013 - link
"Here we see that Beats is adding a +3.5 dB boost from 60 Hz to 90 Hz, but the deviation from 0 dB goes from 30Hz to 300 Hz. Past 6.5 kHz we also see a rise in the treble."And people pay 300 bucks for a headphone that does exactly, and only, this. Its a good joke, really.
willis936 - Monday, December 9, 2013 - link
To Chris:Check out NwAvGuy's blog if you haven't already. He appeared and disappeared a few years ago bringing with him a headphone amp design and (more importantly) a breath of fresh, objective air in testing audiophile headphone equipment. He has some good data there and comparing testing methodologies might be insightful for things to try here on anandtech.
cheinonen - Monday, December 9, 2013 - link
I've read his full blog and wish it was still updated.Impulses - Monday, December 9, 2013 - link
Tyll's Inner Fidelity blog is another great resource.adityanag - Monday, December 9, 2013 - link
This is excellent. Also the reason why I've been reading Anandtech since 1998. Keep up the great work, guys.Gadgety - Monday, December 9, 2013 - link
I appreciate this article, Chris. An improvement would be a summary table of all the models compared on one page, and some sort of analysis beyond the "poor performance" comparison. I've also seen data that the specs will change significantly for worse when headphones are attached to the phones.xodusgenesis - Monday, December 9, 2013 - link
Finally some in-depth audio anlysis. I've been waiting for this as I actually use my smartphone as a phone (I know shocker in today's age) and media player most of the time.ZoSo - Monday, December 9, 2013 - link
Would like to see some results of a few current WP8 phones, Nokia in particular.asgallant - Monday, December 9, 2013 - link
Awesome! I have been wanting to see some audio analysis done for a while now. Is there any chance of extending this to test audio on motherboards, sound cards, and laptops as well?lever_age - Monday, December 9, 2013 - link
Glad to see this. My suggestions are as follows:1. Include an output impedance measurement. If you're using these as decent-quality audio players with headphones, this is one of the most important things to know for certain headphones, at least. Who cares what the measured frequency response with a resistor is if your source's output impedance is causing +/- 5 dB swings in response for some balanced armature IEMs?
2. Standardize THD+N tests to a given output level for all phones (say 0.1 V or whatever else; the danger is picking something standard like 0 dBu that some phones could possibly not even reach). Don't just use whatever the max volume is, especially since that's into clipping territory for some phones. People don't scale their playback levels by how much power the electronics is capable of handling. I hope. Referencing a fixed level is more fair.
3. Please do keep reporting which phones run into clipping (and at what load) at volume settings at max or less. Also what some nonstandard settings like Beats Mode do.
4. Make careful distinction of THD with headphones as load and as not. If not loading with headphones-level impedance that is mostly testing the performance when hooked up to say a speaker system with a patch cable, which I don't think many people are doing these days.
5. When reporting maximum level, standardize to point of say 1% THD (or max volume, whichever comes first). Also note if headphones are used or not. It'd be meaningless to quote maximum levels far past the point of clipping.
6. If you have time, see if you can coax and measure some bad behavior out of the phone by using Wi-Fi, Bluetooth, LTE, etc. simultaneously, maybe some CPU/GPU load and seeing if that causes audio issues. Honestly, glitchy or cackling playback are far greater issues to audio quality than looking at 0.3 vs. 1 dB dips in frequency response at 19 kHz or something like that. Or output power levels most people don't need.