Smartphone Audio Quality Testing
by Chris Heinonen on December 8, 2013 5:15 PM EST- Posted in
- Smartphones
- Audio
- Mobile
- Tablets
- Testing
We spend a lot of time watching and listening to our smartphones and tablets. The younger you are the more likely you are to turn to them for watching a movie or TV show instead of an actual TV. For a lot of us it is our primary source of music with our own content or streaming services. Very rarely when new phones or tablets are announced does a company place any emphasis on the quality of the audio.
Display quality also used to receive very little attention. As more and more people reported on the display performance, more companies started to take notice. Now benefits like “Full sRGB gamut” or “dE < 3” are touted on new products. So now we are going to introduce a new set of testing for smart phones and tablets, audio performance.
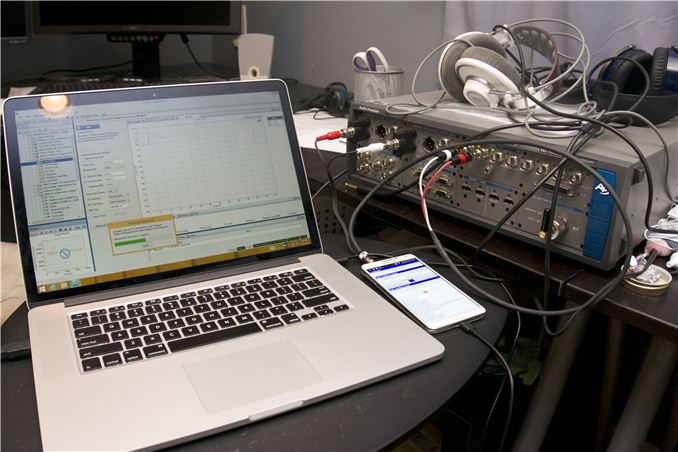
To do this right we went to the same company that all the manufacturers go to: Audio Precision. Based out of Beaverton, OR, Audio Precision has been producing the best audio test equipment out there for over 25 years now. From two channel analog roots they now also test multichannel analog, HDMI, Optical, Coaxial, and even Bluetooth. Their products offer resolution that no one else can, which is why you will find them in the test and production rooms of almost any company.
Just recently they introduced a brand new set of audio tests for Android devices. Combined with one of their audio analyzers, it allows us to provide performance measurements beyond what has been possible before. Using an Audio Precision APx582 analyzer we set out to analyze a selection of Android phones to see what performance difference we can find. More phones and tablets will follow as these tests can be run.
The Test Platform
The test platform is the Audio Precision APx series of audio analyzers. For this initial set of tests I used an APx 582 model, which has two analog outputs and 8 channels of analog inputs. The outputs are not necessary as all of the test tones are provided by Audio Precision for playback on the devices. For each set of tests we can add a load, simulated or real, to see how the device handles more demanding headphones. For this article I am sticking with only a set of the updated Apple Earbuds. They are probably the most common headphone out there and easy to acquire to duplicate testing. For future tests the other loads will be AKG K701 headphones and Grado SR60 headphones. Both models are popular, and I happen to own them.
There are a few main tests we are going to use for all these reviews. Those key tests are maximum output level, Total Harmonic Distortion + Noise (THD+N), Frequency Response, Dynamic Range (as defined by AES17), and Crosstalk. These tests are the exact same ones that manufacturers will be running to verify their products. Most of these tests will be run at maximum output levels. Most amplifiers perform best at close to their maximum levels, as the residual noise compared to the signal decreases, and so that is what they are typically tested at.
We might add more tests as we decide they are relevant to our testing. I will also attempt to go back and fill in as much data as possible from previously reviewed devices as time permits. Now to look at the tests and see our results for our initial set of phones.


188 Comments
View All Comments
Impulses - Monday, December 9, 2013 - link
If I didn't say this on one of my previous comments I'll say it now, thanks for doing this! Audio quality is far too often ignored, specially amongst the PC/tech enthusiast crowd... And it's rarely tested very objectively when it's talked about at all.I wouldn't mind some subjective impressions atop the objective testing though... Or even some more commentary on Chris' part regarding the data itself. Knowing the Nexus 5 is clipping at max volume is one thing, but the reader might not necessarily realize it's not an issue at lower volume levels etc.
UpSpin - Monday, December 9, 2013 - link
Great review, I'm looking forward to further tests.A few suggestions:
- Such graphs are nice for a detailed analysis but useless for an easy comparison between different smartphones. Find a way to break down the important information in those graphs to one or two numbers, which you then list in a bar diagram to allow a comparison across different devices.
- As you pointed out yourself and also other commenters, testing THD at the max. volume might be industry standard, but it's useless for a normal consumer, especially, again, in such a comparison. As in the display tests where Anandtech adjusts to a fixed display brightness across all devices, you should do the same here. Because different headphones require different volume settings you might chose three settings:
A really silent one (fixed dB), a normal one (fixed dB), and the loudest possible (max. power the device offers).
For example on my HTC Desire I use Sony in-ear ear-buds which I drive with the lowest volume setting possible, else it's simply too loud for me.
- Those three volumes also have the advantage to go in detail in specific areas:
The loudest volume setting can be used to determine how much load the smartphone can drive and the consequences (just what you did with the Nexus 5, excellent).
The normal volume setting is a measurement for overall audio quality across all devices, because that's the one most people will use. So there a focus should be kept on dynamic range, frequency response, distortion, ...
The silent setting is to determine in detail the background noise. On my HTC Desire noise is audible with the Sony in-ear ear-buds (not with lower end normal ones). And as you said, if the device can output a lot of power, naturally the noise to signal ratio becomes smaller. But that's artificial and a useless measurement when compared to other devices. So keep the volume at a uniform low setting and measure the noise to get comparable and meaningful results across all devices. Also make sure to include some noise measurement while in Airplane mode and while transfering some data over mobile. Then you can judge how well the analog part was designed.
Impulses - Monday, December 9, 2013 - link
Problem is, the dB values Chris would use would often not correspond with the same volume (and power output) level you'd use, because you're using different headphones with different sensitivities. Settling on different power levels might be more correct but it'd probably leave a lot of people scratching their heads... It might be worth taking a looksee at the way Tyll @ InnerFidelity tests amps and headphones. He's been doing objective tests for quite a while and has found a pretty good balance as far as how to present the data in an easy to digest manner.stepz - Monday, December 9, 2013 - link
Having a couple different fixed power output comparison points should make not matching your exact listening volume less of an issue. At least it's a less arbitrary measurement point than the point where the manufacturer decided to put a virtual stopper on the volume knob. The fact that max volume clips with a specific set of headphones shouldn't matter too much. If the headphone amp is clipping due to limited current available then using higher impedance headphones may be able to use that volume level without clipping. And if aren't able to use it, just don't crank it up that high and problem solved.supergex - Monday, December 9, 2013 - link
Finally I waiting for this for years.Simple and probably stupid question, will you include Windows Phone smartphone?
Many thanks in advance for these tests.
Osamede - Monday, December 9, 2013 - link
Is this novel - or just getting up to par? From what I recall, GSMArena and Mobile-Review have been doing detailed measurement of phone audio performance for years.tom5 - Monday, December 9, 2013 - link
I had the HTC One and it played much louder than the G2 without distortions on the same headphones. HTC One is in many ways ahead of newer phones like the G2 or Z1.eio - Monday, December 9, 2013 - link
Bravo! you guys always set the standard of a proper product review.eio - Monday, December 9, 2013 - link
It would be even more great if interference can be benchmarked, like the noise of I/O, communication while playing a quiet music.panda-fu - Monday, December 9, 2013 - link
This is a step in a good direction!However, I don't think the "issue" with the Nexus 5 was explained properly. What is happening is that the volume control on the Nexus goes high enough that it's possible for the amplifier to run out of power against the specific load. This is perfectly normal, and the practical implication is that the maximum power of that headphone amplifier is lower than your published measurements - the result should be at <1% THD.
Also, all results should list the load against which they were measured. If you allow massive amounts of distortion and don't specify a load, it would be easy enough to claim that a 100W <1% THD into 8 Ohms rated amplifier is "discovered to be able to produce 1000W" - just as long as you disregard it being driven into a 2 Ohm load with over 50% THD.
A metric that might also be of use, and practical in predicting a headphone amplifier's real-world performance, is output impedance. Smartphones and tablets are usually used with low impedance, sensitive headphones, and if the output impedance is relatively high, it can affect real-world frequency response massively - sometimes similar in scale as the EQ you pointed out in one of the measurements. Of course, providing measurements made against a range of headphones with different impedance characteristics, as you seem to intend to do, will point at the same issue if there is any. But in that case, please provide impedance curves of the reference headphones.