Intel Iris Pro 5200 Graphics Review: Core i7-4950HQ Tested
by Anand Lal Shimpi on June 1, 2013 10:01 AM ESTSynthetics
Our synthetic benchmarks can sometimes tell us a lot about what an architecture is capable of. In this case, we do have some unanswered questions about why Intel falls short of the GT 650M in some cases but not in others. We'll turn to 3DMark Vantage first to stress ROP and texel rates.
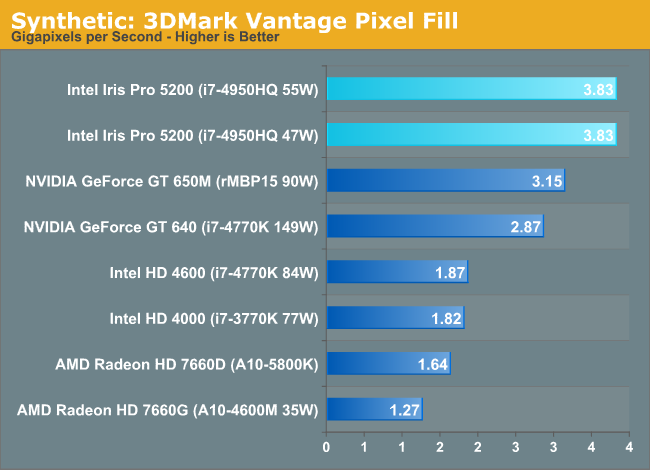
Iris Pro doesn't appear to have a ROP problem, at least not in 3DMark Vantage. NVIDIA can output more pixels than Iris Pro though, so it's entirely possible that we're just not seeing any problems because we're looking at a synthetic test. Comparing the HD 4600 to the Iris Pro 5200 we see near perfect scaling in pixel throughput. Remember the ROP hardware is located in slice common, which is doubled when going from GT2 to GT3. Here we see a near doubling of pixel fillrate as a result.
Moving on, we have our 3DMark Vantage texture fillrate test, which does for texels and texture mapping units what the previous test does for ROPs.
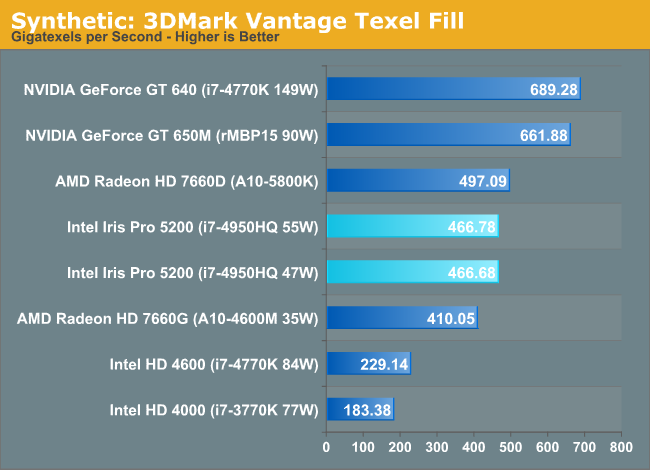
Now this is quite interesting. NVIDIA has a 50% advantage in texturing performance, that's actually higher than what the raw numbers would indicate. It's entirely possible that this is part of what we're seeing manifest itself in some of the game benchmarks.
Finally we’ll take a quick look at tessellation performance with TessMark.
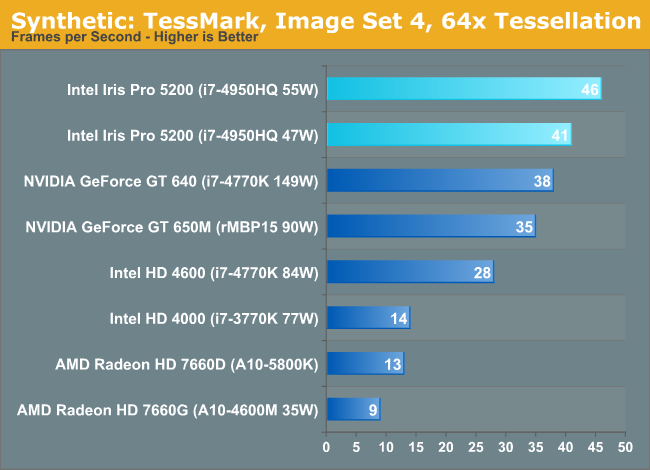
Iris Pro doesn't appear to have a geometry problem. Tessellation performance is very good.


177 Comments
View All Comments
Phrontis - Wednesday, June 5, 2013 - link
I can't wait for one on these on a mITX board such with 3 decent monitor outputs. Theres enough power for the sort of things I do if not for gaming.Phrontis
khanov - Friday, June 7, 2013 - link
Without a direct comparison between HD 5000/5100 and Iris Pro 5200 with Crystalwell,how can we conclude that Crystalwell has any effect in any of the game benchmarks? While it clearly is of benefit in some compute tasks, in the game benchmarks you only compare to HD 4600 with half as many EU's and to Nvidia and AMD with their different architectures.
We really need to see Iris Pro 5200 vs HD5100 to get an apples to apples comparison and be able to determine if Crystalwell is worth the extra money.
MODEL3 - Sunday, June 9, 2013 - link
Haswell ULT GT3 (Dual-Core+GT3) = 181mm2 and 40 EU Haswell GPU is 174mm^2.7mm^2 for everything else except GT3?
n13L5 - Tuesday, June 11, 2013 - link
" An Ultrabook SKU with Crystalwell would make a ton of sense, but given where Ultrabooks are headed (price-wise) I’m not sure Intel could get any takers."They sure seem to be going up in price, rather than down at the moment...
anandfan86 - Tuesday, June 18, 2013 - link
Intel has once again made their naming so confusing that even their own marketing weasels can't get it right. Notice that the Intel slide titled "4th Gen Intel Core Processors H-Processors Line" calls the graphics in the i7-4950HQ and i7-4850HQ "Intel HD Graphics 5200" instead of the correct name which is "Intel Iris Pro Graphics 5200". This slide calls the graphics in the i7-4750HQ "Intel Iris Pro Graphics 5200" which indicates that the slide was made after the creation of that name. It is little wonder that most media outlets are acting as if the biggest tech news of the month is the new pastel color scheme in iOS 7.Myoozak - Wednesday, June 26, 2013 - link
The peak theoretical GPU performance calculations shown are wrong for Intel's GFLOPS numbers. Correct numbers are half of what is shown. The reason is that Intel's execution units are made of of an integer vec4 processor and a floating-point vec4 processor. This article correctly states it has a 2xvec4 SIMD, but does not point out that half is integer and half is floating-point. For a GFLOPS computation, one should only include the floating-point operations, which means only half of that execution unit's silicon is getting used. The reported computation performance would only be correct if you had an algorithm with a perfect mix of integer & float math that could be co-issued. To compare apples to apples, you need to stick to GFLOPS numbers, and divide all the Intel numbers in the table by 2. For example, peak FP ops on the Intel HD4000 would be 8, not 16. Compared this way, Intel is not stomping all over AMD & nVidia for compute performance, but it does appear they are catching up.alexcyn - Tuesday, August 6, 2013 - link
I heard that Intel 22nm process equals TSMS 26nm, so the difference is not that much.alexcyn - Tuesday, August 6, 2013 - link
I heard that Intel 22nm process equals TSMC 26nm, so the difference is not that big.Doughboy(^_^) - Friday, August 9, 2013 - link
I think Intel could push their yield way up by offering 32MB and 64MB versions of Crystalwell for i3 and i5 processors. They could charge the same markup for the 128, but sell the 32/64 for cheaper. It would cost Intel less and probably let them take even further market share from low-end dGPUs.krr711 - Monday, February 10, 2014 - link
It is funny how a non-PC company changed the course of Intel forever for the good. I hope that Intel is wise enough to use this to spring-board the PC industry to a new, grand future. No more tick-tock nonsense arranged around sucking as many dollars out of the customer as possible, but give the world the processing power it craves and needs to solve the problems of tomorrow. Let this be your heritage and your profits will grow to unforeseen heights. Surprise us!