Choosing a Gaming CPU at 1440p: Adding in Haswell
by Ian Cutress on June 4, 2013 10:00 AM ESTCPU Benchmarks
Point Calculations - 3D Movement Algorithm Test
The algorithms in 3DPM employ both uniform random number generation or normal distribution random number generation, and vary in amounts of trigonometric operations, conditional statements, generation and rejection, fused operations, etc. The benchmark runs through six algorithms for a specified number of particles and steps, and calculates the speed of each algorithm, then sums them all for a final score. This is an example of a real world situation that a computational scientist may find themselves in, rather than a pure synthetic benchmark. The benchmark is also parallel between particles simulated, and we test the single threaded performance as well as the multi-threaded performance.
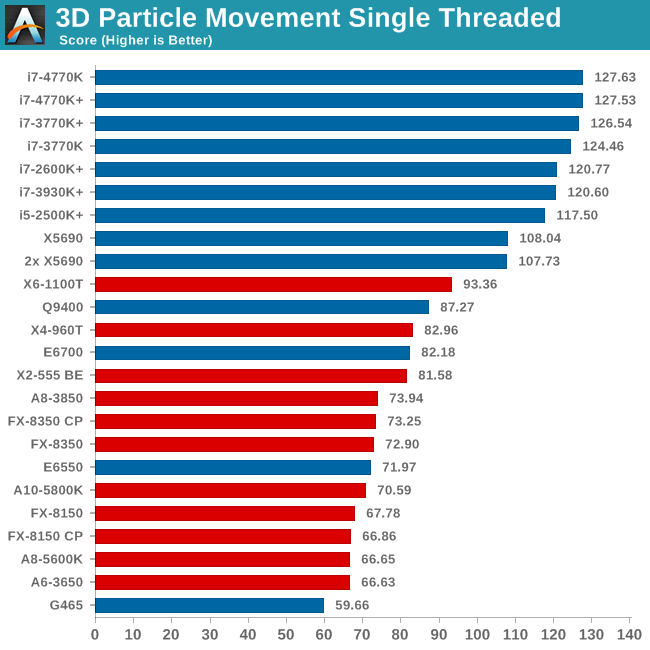
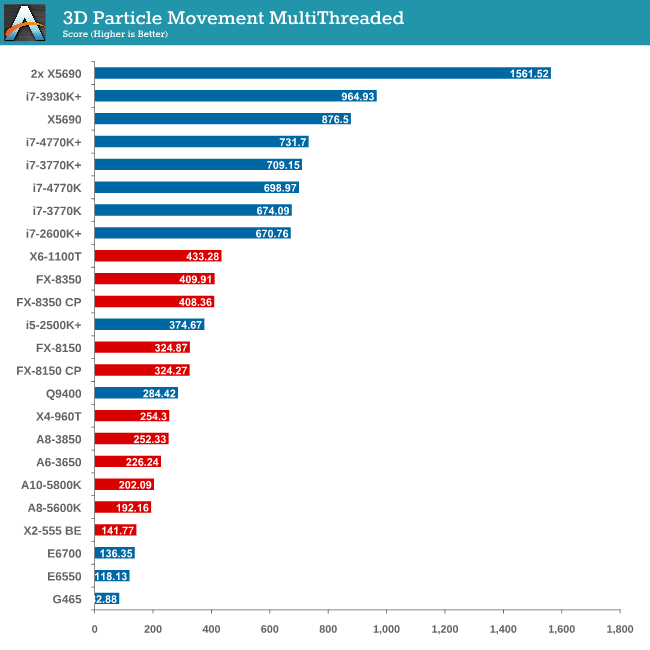
As mentioned in previous reviews, this benchmark is written how most people would tackle the situation – using floating point numbers. This is also where Intel excels, compared to AMD’s decision to move more towards INT ops (such as hashing), which is typically linked to optimized code or normal OS behavior.
The 4770K comes in top in single threaded performance, showcasing the IPC gains of the new architecture. This is also shown in multithreaded tests with MCT both off and on.
Compression - WinRAR x64 3.93 + WinRAR 4.2
With 64-bit WinRAR, we compress the set of files used in our motherboard USB speed tests. WinRAR x64 3.93 attempts to use multithreading when possible and provides a good test for when a system has variable threaded load. WinRAR 4.2 does this a lot better! If a system has multiple speeds to invoke at different loading, the switching between those speeds will determine how well the system will do.
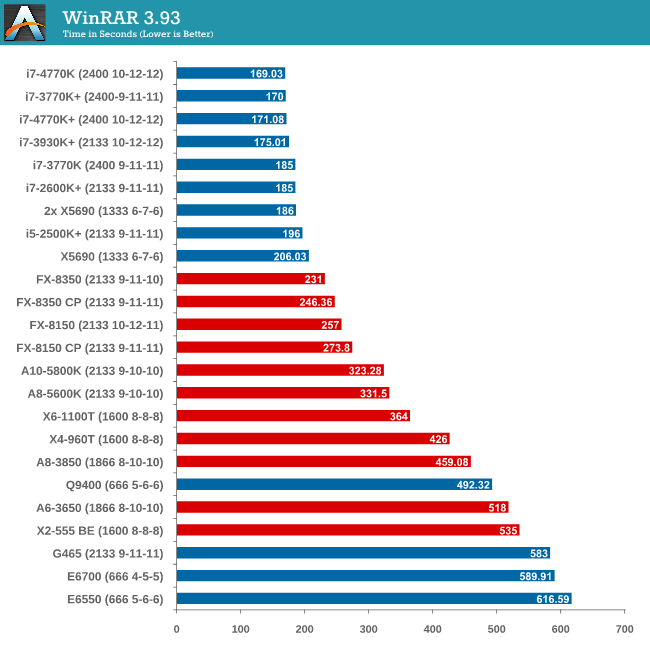
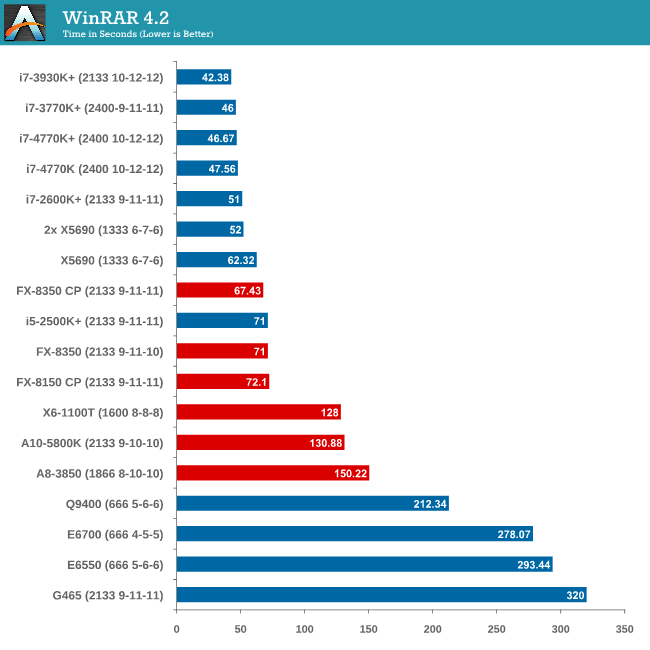
Due to the late inclusion of 4.2, our results list for it is a little smaller than I would have hoped. But it is interesting to note that with the Core Parking updates, an FX-8350 overtakes an i5-2500K with MCT.
Image Manipulation - FastStone Image Viewer 4.2
FastStone Image Viewer is a free piece of software I have been using for quite a few years now. It allows quick viewing of flat images, as well as resizing, changing color depth, adding simple text or simple filters. It also has a bulk image conversion tool, which we use here. The software currently operates only in single-thread mode, which should change in later versions of the software. For this test, we convert a series of 170 files, of various resolutions, dimensions and types (of a total size of 163MB), all to the .gif format of 640x480 dimensions.
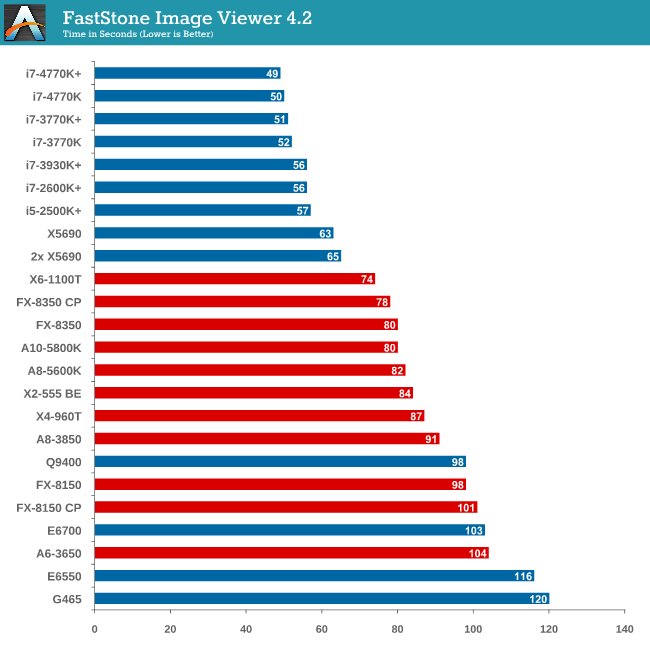
In terms of pure single thread speed, it is worth noting the X6-1100T is leading the AMD pack, and the 4770K takes the top spot. .
Video Conversion - Xilisoft Video Converter 7
With XVC, users can convert any type of normal video to any compatible format for smartphones, tablets and other devices. By default, it uses all available threads on the system, and in the presence of appropriate graphics cards, can utilize CUDA for NVIDIA GPUs as well as AMD WinAPP for AMD GPUs. For this test, we use a set of 33 HD videos, each lasting 30 seconds, and convert them from 1080p to an iPod H.264 video format using just the CPU. The time taken to convert these videos gives us our result.
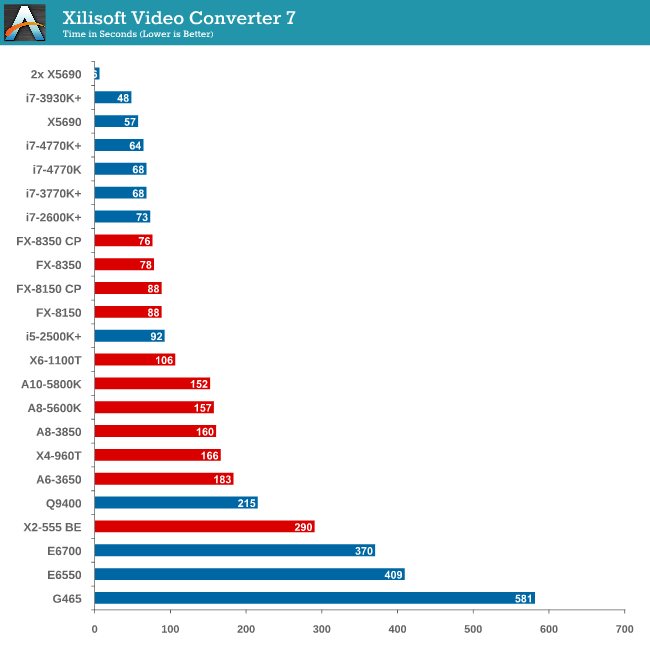
XVC is a little odd in how it arranges its multicore processing. For our set of 33 videos, it will arrange them in batches of threads – so if we take the 8 thread FX-8350, it will arrange the videos into 4 batches of 8, and then a fifth batch of one. That final batch will only have one thread assigned to it (!), and will not get a full 8 threads worth of power. This is also why the 2x X5690 finishes in 6 seconds but the normal X5690 takes longer – you would expect a halving of time moving to two CPUs but XVC arranges the batches such that there is always one at the end that only gets a single thread.
Rendering – PovRay 3.7
The Persistence of Vision RayTracer, or PovRay, is a freeware package for as the name suggests, ray tracing. It is a pure renderer, rather than modeling software, but the latest beta version contains a handy benchmark for stressing all processing threads on a platform. We have been using this test in motherboard reviews to test memory stability at various CPU speeds to good effect – if it passes the test, the IMC in the CPU is stable for a given CPU speed. As a CPU test, it runs for approximately 2-3 minutes on high end platforms.
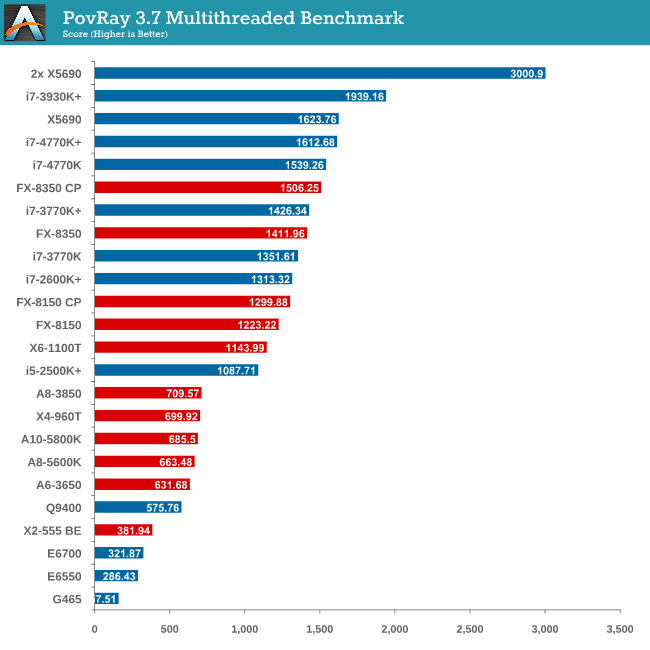
The SMP engine in PovRay is not perfect, though scaling up in CPUs gives almost a 2x effect. The results from this test are great – here we see an FX-8350 CPU below an i7-3770K (with MCT), until the Core Parking updates are applied, meaning the FX-8350 performs better! The 4770K also has a chance to flex its compute muscles, performing almost as well as the 8-core Westmere CPU.
Video Conversion - x264 HD Benchmark
The x264 HD Benchmark uses a common HD encoding tool to process an HD MPEG2 source at 1280x720 at 3963 Kbps. This test represents a standardized result which can be compared across other reviews, and is dependent on both CPU power and memory speed. The benchmark performs a 2-pass encode, and the results shown are the average of each pass performed four times.
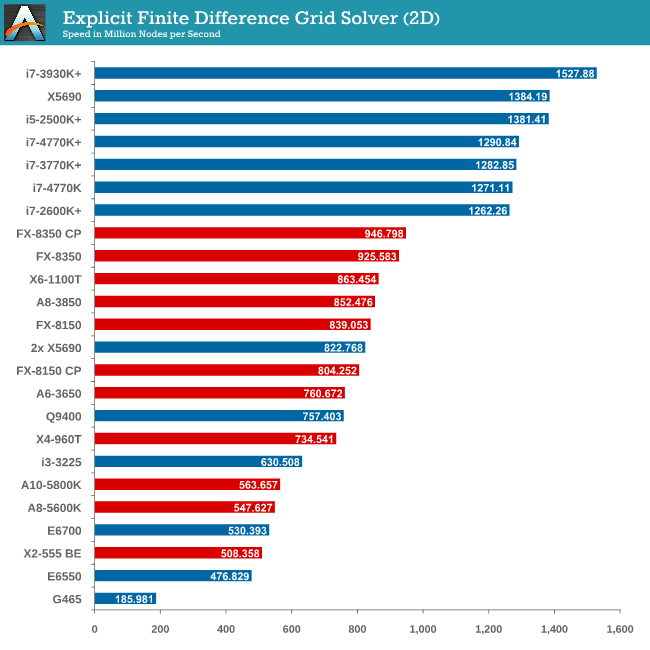
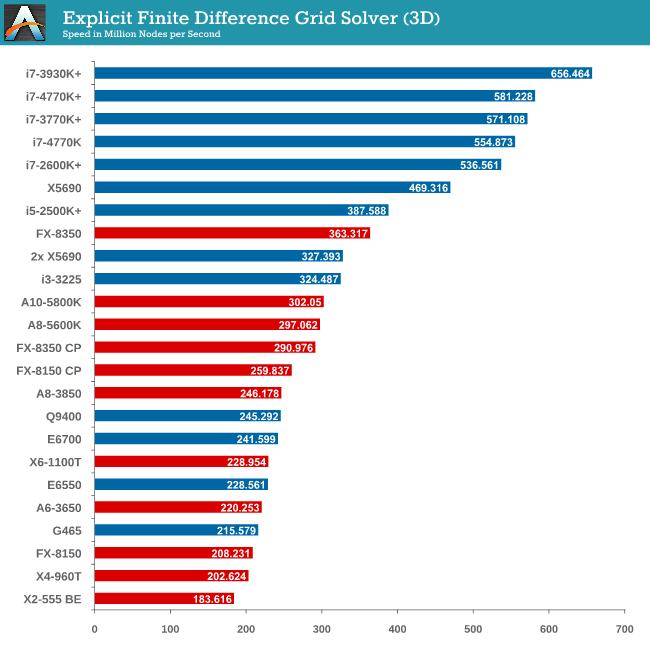
Grid Solvers - Explicit Finite Difference
For any grid of regular nodes, the simplest way to calculate the next time step is to use the values of those around it. This makes for easy mathematics and parallel simulation, as each node calculated is only dependent on the previous time step, not the nodes around it on the current calculated time step. By choosing a regular grid, we reduce the levels of memory access required for irregular grids. We test both 2D and 3D explicit finite difference simulations with 2n nodes in each dimension, using OpenMP as the threading operator in single precision. The grid is isotropic and the boundary conditions are sinks. Values are floating point, with memory cache sizes and speeds playing a part in the overall score.
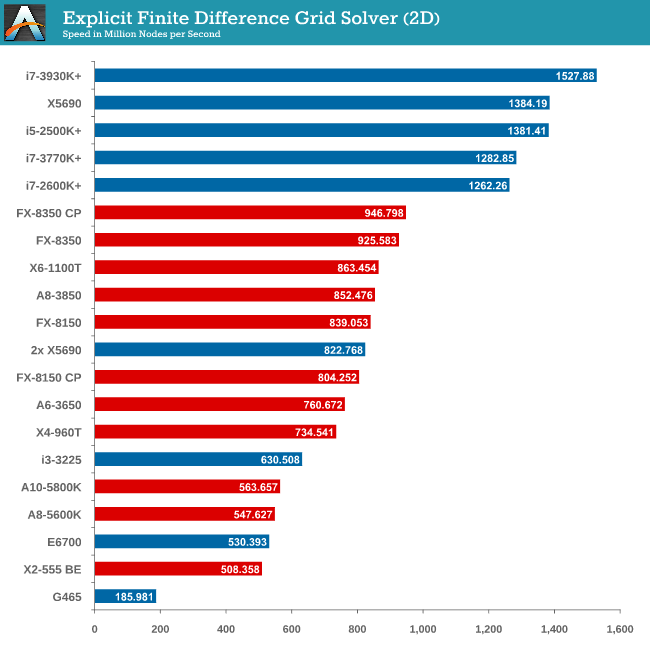

Grid solvers do love a fast processor and plenty of cache in order to store data. When moving up to 3D, it is harder to keep that data within the CPU and spending extra time coding in batches can help throughput. Our simulation takes a very naïve approach in code, using simple operations.
Grid Solvers - Implicit Finite Difference + Alternating Direction Implicit Method
The implicit method takes a different approach to the explicit method – instead of considering one unknown in the new time step to be calculated from known elements in the previous time step, we consider that an old point can influence several new points by way of simultaneous equations. This adds to the complexity of the simulation – the grid of nodes is solved as a series of rows and columns rather than points, reducing the parallel nature of the simulation by a dimension and drastically increasing the memory requirements of each thread. The upside, as noted above, is the less stringent stability rules related to time steps and grid spacing. For this we simulate a 2D grid of 2n nodes in each dimension, using OpenMP in single precision. Again our grid is isotropic with the boundaries acting as sinks. Values are floating point, with memory cache sizes and speeds playing a part in the overall score.
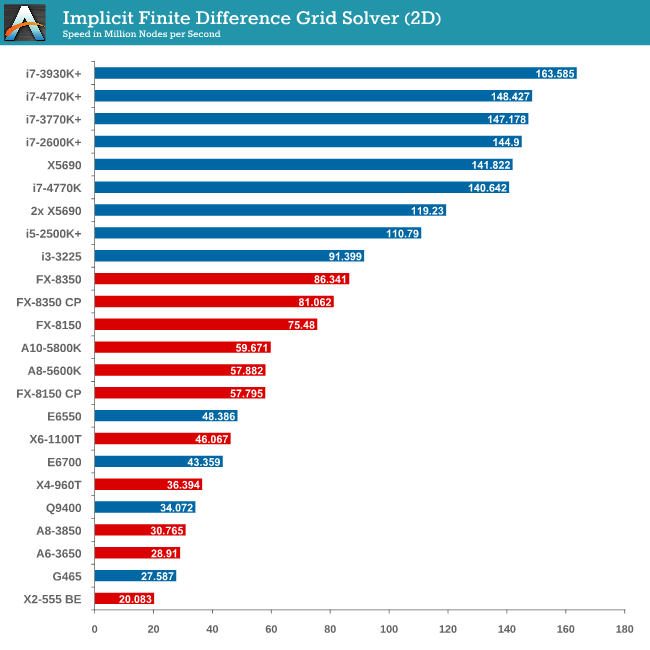
2D Implicit is harsher than an Explicit calculation – each thread needs more a lot memory, which only ever grows as the size of the simulation increases.
Point Calculations - n-Body Simulation
When a series of heavy mass elements are in space, they interact with each other through the force of gravity. Thus when a star cluster forms, the interaction of every large mass with every other large mass defines the speed at which these elements approach each other. When dealing with millions and billions of stars on such a large scale, the movement of each of these stars can be simulated through the physical theorems that describe the interactions. The benchmark detects whether the processor is SSE2 or SSE4 capable, and implements the relative code. We run a simulation of 10240 particles of equal mass - the output for this code is in terms of GFLOPs, and the result recorded was the peak GFLOPs value.
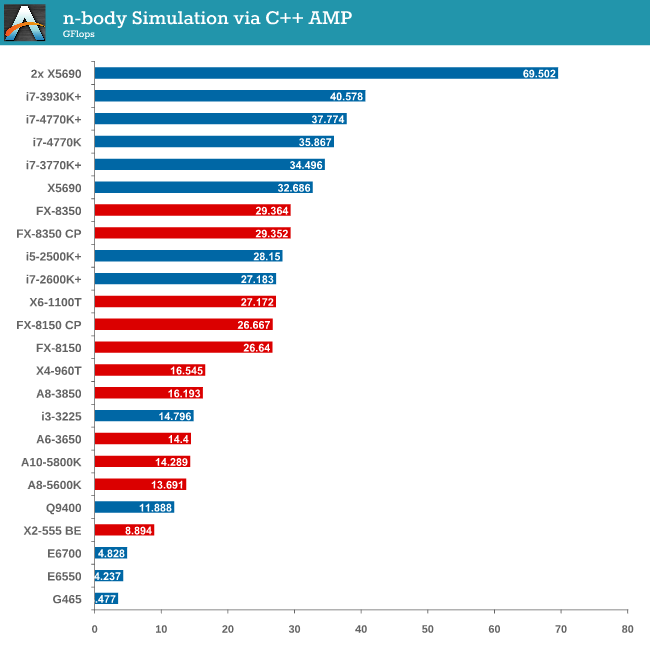
As we only look at base/SSE2/SSE4 depending on the processor (auto-detection), we don’t see full AVX numbers in terms of FLOPs.


116 Comments
View All Comments
IanCutress - Tuesday, June 4, 2013 - link
Hi Ternie,To answer your questions:
(1) Unfortunately for a lot of users, even DIY not just system integrators, they leave the motherboard untouched (even at default memory, not XMP). So choosing that motherboard with MCT might make a difference in performance. Motherboards without MCT are also different between themselves, depending on how quickly they respond to CPU loading and ramp up the speed, and then if they push it back down to idle immediately in a low period or keep the high turbo for a few seconds in case the CPU loading kicks back in.
2) This is a typo - I was adding too many + CPU results at the same time and got carried away.
3) While people have requested more 'modern' games, there are a couple of issues. If I release something that has just come out, the older drivers I have to use for consistency will either perform poorly or not scale (case in point, Sleeping Dogs on Catalyst 12.3). If I am then locked into those drivers for a year, users will complain that this review uses old drivers that don't have the latest performance increases (such as 8% a month for new titles not optimized) and that my FPS numbers are unbalanced. That being said, I am looking at what to do for 2014 and games - it has been suggested that I put in Bioshock Infinite and Tomb Raider, perhaps cut one or two. If there are any suggestions, please email me with thoughts. I still have to keep the benchmarks regular and have to run without attention (timedemos with AI are great), otherwise other reviews will end up being neglected. Doing this sort of testing could easily be a full time job, which in my case should be on motherboards and this was something extra I thought would be a good exercise.
Michaelangel007 - Tuesday, June 4, 2013 - link
It is sad to poor journalism in the form of excuses in an otherwise excellent article. :-/1. Any review sites that make excuses for why they ignore FCAT just highlights that they don't _really_ understand the importance of _accurate_ frame stats.
2. Us hardcore games can _easily_ tell the difference betwen 60 Hz and 30 Hz. I bought a Titan to play games at 1080p @ 100+ Hz on the Asus VG248QE using nVidia's LightBoost to eliminate ghosting. You do your readers a dis-service by again not understand the issue.
3. Focusing on 1440 is largely useless as it means people can't directly compare how their Real-World (tm) system compares to the benchmarks.
4. If your benchmarks are not _exactly_ reproducible across multiple systems you are doing it wrong. Name & Shame games that don't allow gamers to run benchmarks. Use "standard" cut-scenes for _consistency_.
It is sad to see the quality of a "tech" article gloss and trivial important details.
AssBall - Tuesday, June 4, 2013 - link
Judging by your excellent command of English, I don't think you could identify a decent technical article if it slapped you upside the head and banged your sister.Razorbak86 - Tuesday, June 4, 2013 - link
LOL. I have to agree. :)Michaelangel007 - Wednesday, June 5, 2013 - link
There is a reason Tom's Hardware, Hard OCP, guru3d, etc. uses FCAT.I feel sad that you and AnandTech tech writers are to stupid to understand the importance of high frame rates (100 Hz vs 60 Hz vs 30 Hz), frame time variance, 99 percentile, proper CPU-GPU load balancing, and micro stuttering. One of these days when you learn how to spell 'ad hominem' you might actually have something _constructive_ to add to the discussion. Shooting the messenger instead of focusing on the message shows you are still a immature little shit that doesn't know anything about GPUs.
Ignoring the issue (no matter how badly communicated) doesn't make it go away.
What are _you_ doing to help raise awareness about sloppy journalism?
DaveninCali - Tuesday, June 4, 2013 - link
Why doesn't this long article include AMD's latest APU, the Richland 6800K? Heck you can even buy it now on Newegg.ninjaquick - Tuesday, June 4, 2013 - link
The data collected in this article is likely a week or two old. Richland was not available at that time. It takes an extremely long time to do this kind of testing.DaveninCali - Tuesday, June 4, 2013 - link
Richland was launched today. Haswell was launched two days ago. Neither CPU was available two weeks ago. It all depends on review units being released to review websites. Either Richland was left out because it wasn't different enough from Trinity to matter or AMD did not hand out review units.majorleague - Wednesday, June 5, 2013 - link
Here is a youtube link showing 3dmark11 and windows index rating for the 4770k 3.5ghz Haswell. Not overclocked.Youtube link:
http://www.youtube.com/watch?v=k7Yo2A__1Xw
Chicken76 - Tuesday, June 4, 2013 - link
Ian, in the table on page 2 there's a mistake: the Phenom II X4 960T has a stock speed of 3 GHz (you listed 3.2 GHz) and it does turbo up to 3.4 GHz.