NVIDIA GeForce GTX 780 Review: The New High End
by Ryan Smith on May 23, 2013 9:00 AM ESTOur First FCAT & The Test
First announced back at the end of March, FCAT has been something of a bewildering experience for us. NVIDIA has actually done a great job on the software, but between picky games, flaky DVI cables, and dead SSDs (we killed an Intel enterprise grade SSD 910 with FCAT) things have not gone quite to plan, pushing back our intended use of FCAT more than once. In any case, with most of the kinks worked out we’re ready to start integrating it into our major GPU reviews.
For the time being we’re putting FCAT on beta status, as we intend to try out a few different methods of presenting data to find something that’s meaningful, useful, and legible. To that end we’d love to get your feedback in our comments section so that we can further iterate on our presentation and data collection.
We’ve decided to go with two metrics for our first run with FCAT. The first metric is rather simple: 95th percentile frametimes. For years we’ve done minimum framerates (when practical), which are similar in concept, so this allows us to collect similar stats at the end of the rendering pipeline while hopefully avoiding some of the quirkiness that comes from looking at minimum framerates within games themselves. The 95th percentile frametime is quite simply the amount of time it takes to render the slowest 5% of frames. If a game or video card is introducing significant one-off stuttering by taking too long to render some frames, this will show us.
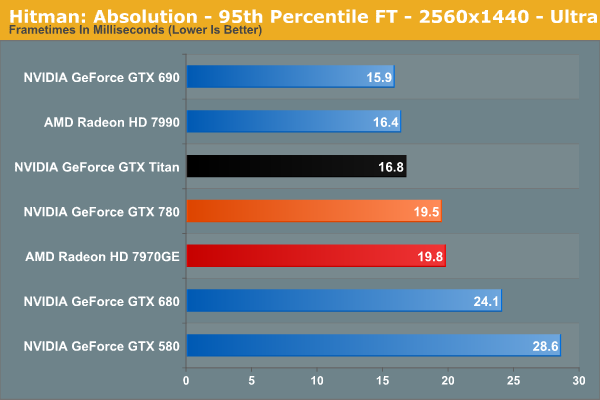
This is primarily meant to capture single-GPU issues, but in practice with AMD having fixed the bulk of their single-GPU issues months ago, we don’t actually expect much. None the less it’s a good way of showing that nothing interesting is happening in those situations.
Our second metric is primarily focused on multi-GPU setups, and is an attempt to quantize the wild frametime variations seen at times with multi-GPU setups, which show up as telltale zigzag lines in frametime graphs.
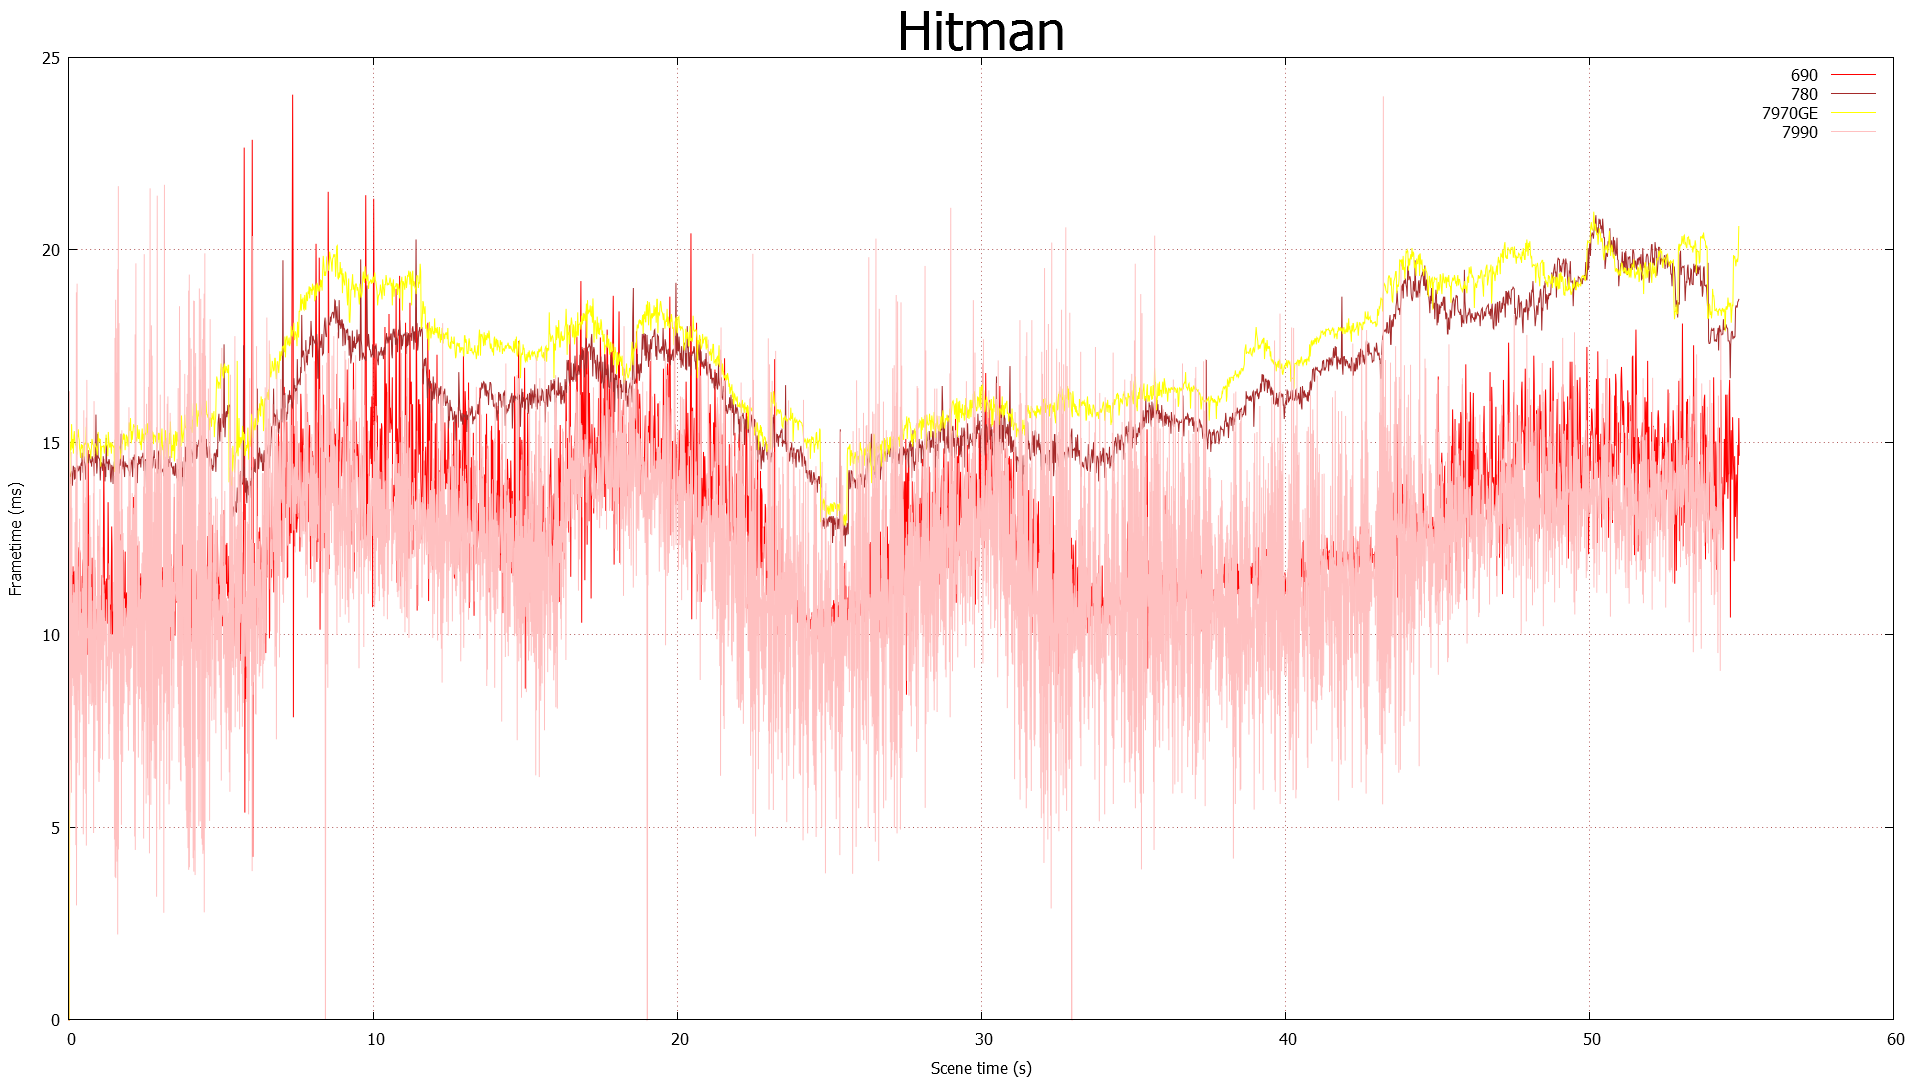
In this metric, which for the moment we’re calling Delta Percentages, we’re collecting the deltas (differences) between frametimes, averaging that out, and then running the delta average against the average frametime of the entire run. The end result of this process is that we can measure whether sequential frames are rendering in roughly the same amount of time, while controlling for performance differences by looking at the data relative to the average frametime (rather than as absolute time).
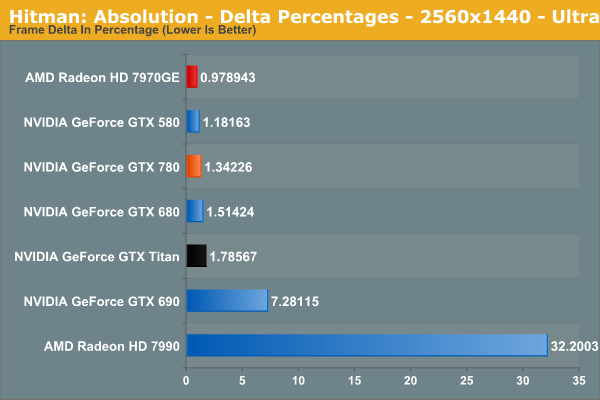
In general, a properly behaving single-GPU card should have a delta average of under 3%, with the specific value depending in part on how variable the workload is throughout any given game benchmark. 3% may sound small, but since we’re talking about an average it means it’s weighed against the entire run. The higher the percentage the more unevenly frames are arriving, and exceeding 3% is about where we expect players with good eyes to start noticing a difference. Alternatively in a perfectly frame metered situation, such as v-sync enabled with a setup that can always hit 60fps, then this would be a flat 0%, representing the pinnacle of smoothness.
Moving on, we’ll be running FCAT against 6 of our 10 games for the time being: Sleeping Dogs, Hitman: Absolution, Total War: Shogun 2, Battlefield 3, Bioshock, and Crysis 3. The rest of our games are either highly inconsistent or generally fussy, introducing too much variance into our FCAT results.
Finally, due to the amount of additional time it takes to put together FCAT results, we’re going to primarily publish FCAT results with major product launches and major driver updates. Due to how frame metering works, the only time frame consistency significantly changes is either with the introduction of new architectures/GPUs, or with the introduction of significant driver changes, so those are the scenarios we’ll be focusing on.
The Test
NVIDIA’s launch drivers for the GTX 780 are 320.18, drivers that are essentially identical to the public 320.14 drivers released last week.
| CPU: | Intel Core i7-3960X @ 4.3GHz |
| Motherboard: | EVGA X79 SLI |
| Power Supply: | Antec True Power Quattro 1200 |
| Hard Disk: | Samsung 470 (256GB) |
| Memory: | G.Skill Ripjaws DDR3-1867 4 x 4GB (8-10-9-26) |
| Case: | Thermaltake Spedo Advance |
| Monitor: | Samsung 305T |
| Video Cards: |
AMD Radeon HD 7970 GHz Edition AMD Radeon HD 7990 NVIDIA GeForce GTX 580 NVIDIA GeForce GTX 680 NVIDIA GeForce GTX 690 NVIDIA GeForce GTX 780 NVIDIA GeForce GTX Titan |
| Video Drivers: |
NVIDIA ForceWare 320.14 NVIDIA ForceWare 320.18 AMD Catalyst 13.5 Beta 2 |
| OS: | Windows 8 Pro |


155 Comments
View All Comments
aidivn - Thursday, May 23, 2013 - link
so, how many Double Precision units are there in each SMX unit of gtx780? titan had 64 dp units in each of their SMX units which totaled to 896 dp unitsAnd can u turn them on or off from the forcewre driver menu like “CUDA – Double Precision” for gtx780?
Ryan Smith - Thursday, May 23, 2013 - link
Hardware wise this is GK110, so the 64 DP units are there. But most of them would be disabled to get the 1/24 FP64 rate.aidivn - Friday, May 24, 2013 - link
so how many are disabled and how many are enabled (numbers please)?Ryan Smith - Friday, May 24, 2013 - link
You would have only 1/8th enabled. So 8 per SMX are enabled, while the other 56 are disabled.aidivn - Saturday, May 25, 2013 - link
so, the GTX780 only has 96 DP units enabled while the GTX TITAN has 896 DP units enabled...thats a huge cut on double precisionDanNeely - Sunday, May 26, 2013 - link
That surprised me too. Previously the cards based on the G*100/110 cards were 1/8; this is a major hit vs the 580/480/280 series cards.Old_Fogie_Late_Bloomer - Thursday, May 23, 2013 - link
"GTX 780 on the other hand is a pure gaming/consumer part like the rest of the GeForce lineup, meaning NVIDIA has stripped it of Titan’s marquee compute feature: uncapped double precision (FP64) performance. As a result GTX 780 can offer 90% of GTX Titan’s gaming performance, but it can only offer a fraction of GTX Titan’s FP64 compute performance, topping out at 1/24th FP32 performance rather than 1/3rd like Titan."Seriously, this is just...it's asinine. Utterly asinine.
tipoo - Thursday, May 23, 2013 - link
Market segmentation is nothing new. The Titan really is a steal if you need DP, the next card up is 2400 dollars.Old_Fogie_Late_Bloomer - Thursday, May 23, 2013 - link
I'm well aware of the existence of market segmentation, but this is just ridiculous. Putting ECC RAM on professional cards is segmentation. Disabling otherwise functional features of hardware, most likely in the software drivers...that's just...ugh.SymphonyX7 - Thursday, May 23, 2013 - link
I just noticed that the Radeon HD 7970 Ghz Edition has been trouncing the GTX 680 in most of the benchmarks and trailing the GTX 680 in those benchmarks that traditionally favored Kepler. What the heck just happened? Didn't the review of the Radeon HD 7970 Ghz Edition say that it was basically tied with the GTX 680?