NVIDIA GeForce GTX 780 Review: The New High End
by Ryan Smith on May 23, 2013 9:00 AM ESTOur First FCAT & The Test
First announced back at the end of March, FCAT has been something of a bewildering experience for us. NVIDIA has actually done a great job on the software, but between picky games, flaky DVI cables, and dead SSDs (we killed an Intel enterprise grade SSD 910 with FCAT) things have not gone quite to plan, pushing back our intended use of FCAT more than once. In any case, with most of the kinks worked out we’re ready to start integrating it into our major GPU reviews.
For the time being we’re putting FCAT on beta status, as we intend to try out a few different methods of presenting data to find something that’s meaningful, useful, and legible. To that end we’d love to get your feedback in our comments section so that we can further iterate on our presentation and data collection.
We’ve decided to go with two metrics for our first run with FCAT. The first metric is rather simple: 95th percentile frametimes. For years we’ve done minimum framerates (when practical), which are similar in concept, so this allows us to collect similar stats at the end of the rendering pipeline while hopefully avoiding some of the quirkiness that comes from looking at minimum framerates within games themselves. The 95th percentile frametime is quite simply the amount of time it takes to render the slowest 5% of frames. If a game or video card is introducing significant one-off stuttering by taking too long to render some frames, this will show us.
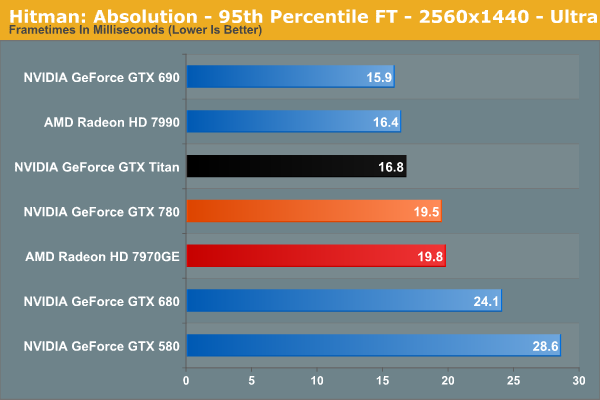
This is primarily meant to capture single-GPU issues, but in practice with AMD having fixed the bulk of their single-GPU issues months ago, we don’t actually expect much. None the less it’s a good way of showing that nothing interesting is happening in those situations.
Our second metric is primarily focused on multi-GPU setups, and is an attempt to quantize the wild frametime variations seen at times with multi-GPU setups, which show up as telltale zigzag lines in frametime graphs.
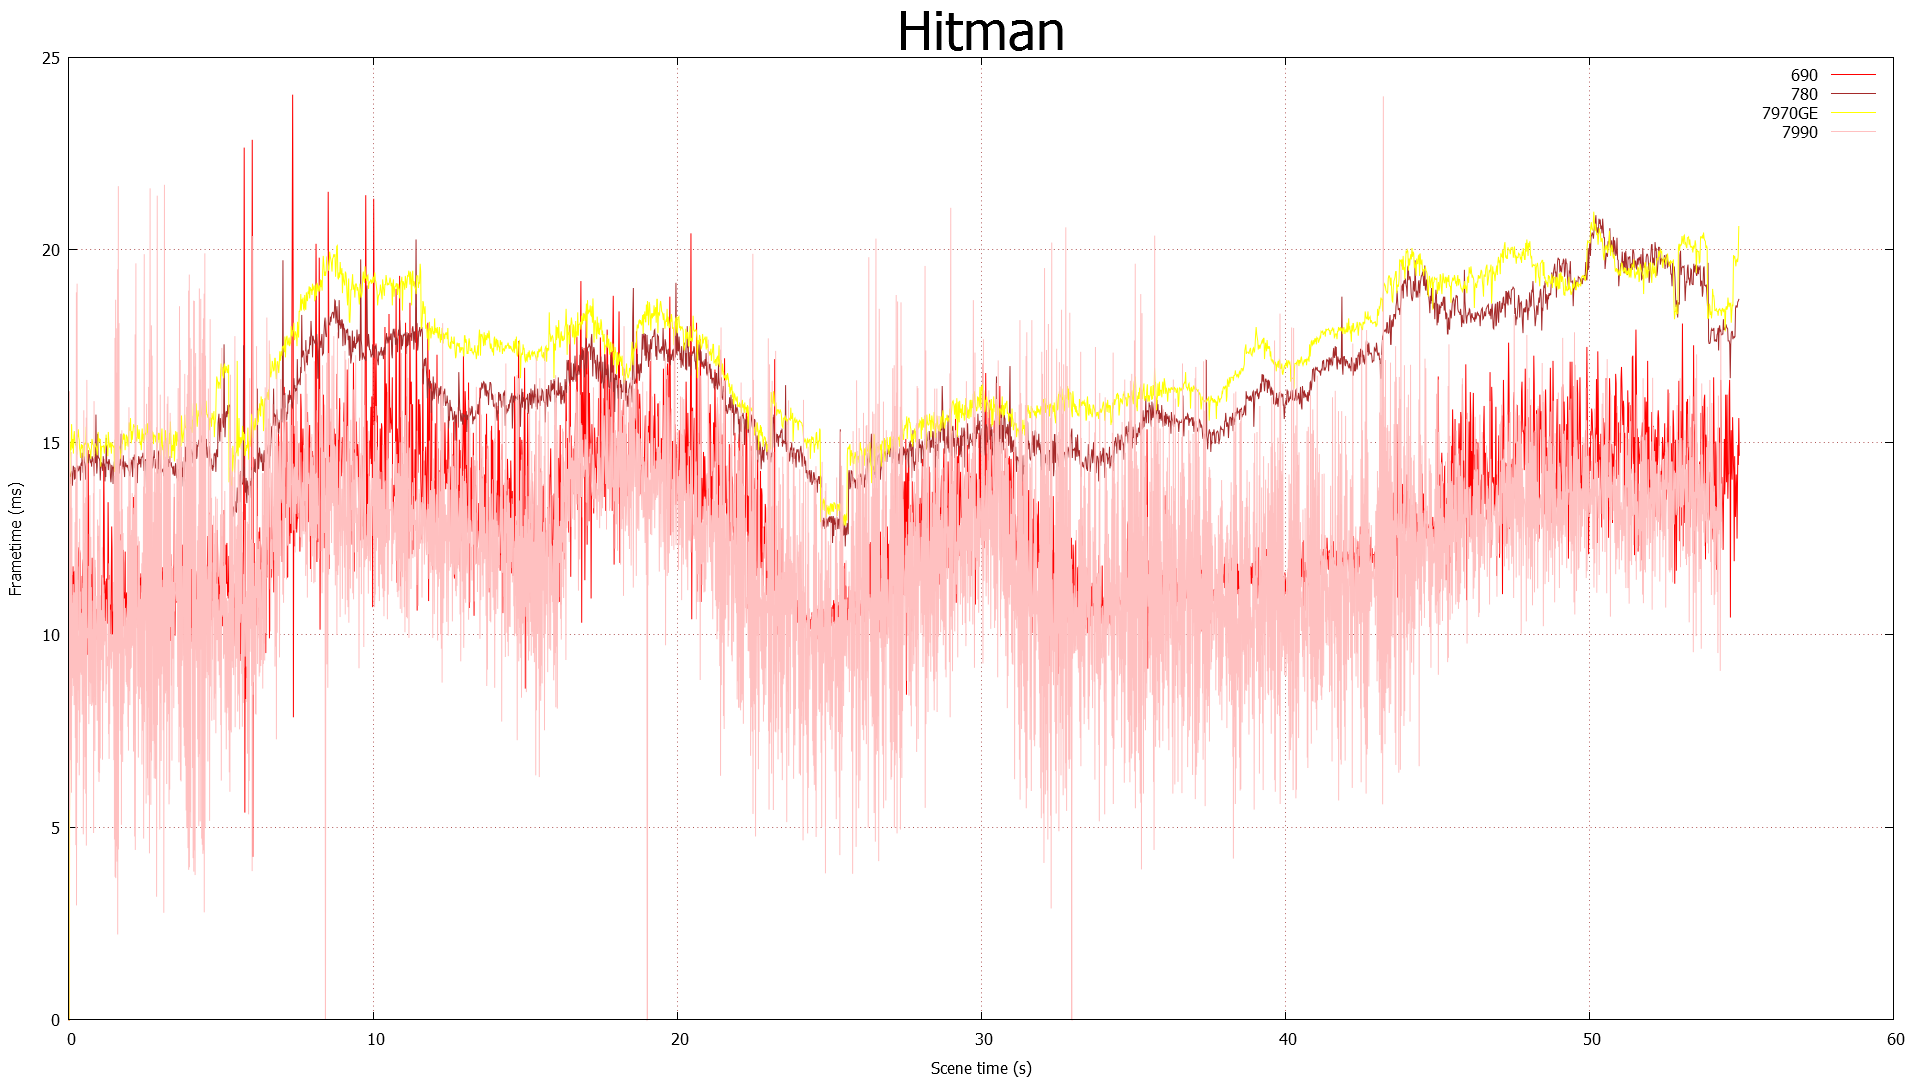
In this metric, which for the moment we’re calling Delta Percentages, we’re collecting the deltas (differences) between frametimes, averaging that out, and then running the delta average against the average frametime of the entire run. The end result of this process is that we can measure whether sequential frames are rendering in roughly the same amount of time, while controlling for performance differences by looking at the data relative to the average frametime (rather than as absolute time).
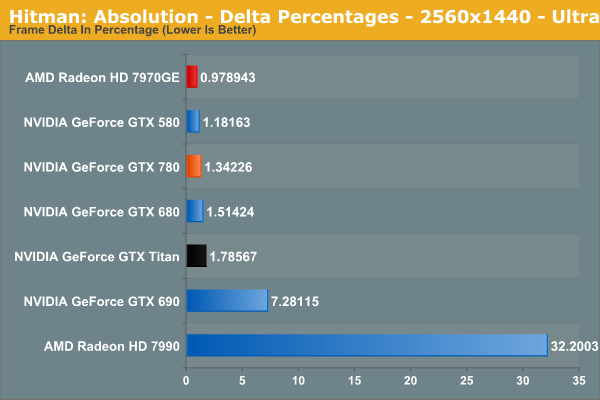
In general, a properly behaving single-GPU card should have a delta average of under 3%, with the specific value depending in part on how variable the workload is throughout any given game benchmark. 3% may sound small, but since we’re talking about an average it means it’s weighed against the entire run. The higher the percentage the more unevenly frames are arriving, and exceeding 3% is about where we expect players with good eyes to start noticing a difference. Alternatively in a perfectly frame metered situation, such as v-sync enabled with a setup that can always hit 60fps, then this would be a flat 0%, representing the pinnacle of smoothness.
Moving on, we’ll be running FCAT against 6 of our 10 games for the time being: Sleeping Dogs, Hitman: Absolution, Total War: Shogun 2, Battlefield 3, Bioshock, and Crysis 3. The rest of our games are either highly inconsistent or generally fussy, introducing too much variance into our FCAT results.
Finally, due to the amount of additional time it takes to put together FCAT results, we’re going to primarily publish FCAT results with major product launches and major driver updates. Due to how frame metering works, the only time frame consistency significantly changes is either with the introduction of new architectures/GPUs, or with the introduction of significant driver changes, so those are the scenarios we’ll be focusing on.
The Test
NVIDIA’s launch drivers for the GTX 780 are 320.18, drivers that are essentially identical to the public 320.14 drivers released last week.
| CPU: | Intel Core i7-3960X @ 4.3GHz |
| Motherboard: | EVGA X79 SLI |
| Power Supply: | Antec True Power Quattro 1200 |
| Hard Disk: | Samsung 470 (256GB) |
| Memory: | G.Skill Ripjaws DDR3-1867 4 x 4GB (8-10-9-26) |
| Case: | Thermaltake Spedo Advance |
| Monitor: | Samsung 305T |
| Video Cards: |
AMD Radeon HD 7970 GHz Edition AMD Radeon HD 7990 NVIDIA GeForce GTX 580 NVIDIA GeForce GTX 680 NVIDIA GeForce GTX 690 NVIDIA GeForce GTX 780 NVIDIA GeForce GTX Titan |
| Video Drivers: |
NVIDIA ForceWare 320.14 NVIDIA ForceWare 320.18 AMD Catalyst 13.5 Beta 2 |
| OS: | Windows 8 Pro |


155 Comments
View All Comments
mac2j - Thursday, May 23, 2013 - link
The problem with $650 vs $500 for this price point is this:I can get 2 x 7950s for <$600 - that's a setup that destroys a 780 for less money.
Even if you're single-GPU limited $250 is a lot of extra cash for a relative small amount of performance gain.
Ytterbium - Thursday, May 23, 2013 - link
I'm disappointed they decided to cut the compute to 1/24 vs 1/3 in Titan, AMD is much better value for compute tasks.BiffaZ - Friday, May 24, 2013 - link
Except much consumer (@home type) compute is SP not DP so it won't make much difference. SP performance is around equal or higher than AMD's in 780.Nighyal - Thursday, May 23, 2013 - link
I don't know if this is possible but it would be great to see a benchmark that showed power, noise and temperature at a standard work load. We can get an inferred idea of clock per watt performance but when you're measuring a whole system other factors come into play (you mentioned CPU loads scaling with increased GPU performance).My interest in this comes from living in a hot climate (Australia) where a computer can throw out a very noticeable amount of heat. The large majority of my usage is light gaming (LoL) but I occasionally play quite demanding single player titles which stretches the legs of my GPU. The amount of heat thrown out is directly proportional to power draw so to be able to clearly see how many less watts a system requires for a controlled work load would be a handy comparison for me.
TL:DR - Please also measure temperature, noise and power at a controlled workload to isolate clock per watt performance.
BiggieShady - Friday, May 24, 2013 - link
Kudos on the FCAT and the delta percentages metrics. So 32,2% for 7990 means that on average one frame is present 32,2% more time than the next. Still, it is only an average. Great extra info would be to show same metrics that averages only the deltas higher then the threshold delta, and display it on the graph with varying thresholds.flexy - Friday, May 24, 2013 - link
NV releases a card with a ridiculous price point of $1000. Then they castrate the exact same card and give it a new name, making it look like it's a "new card" and sell it cheaper than their way overpriced high end card. Which, of course, is a "big deal" (sarcasm) given the crazy price of Titan. So or so, I don't like what NV does, in the slightest.Many ages ago, people could buy *real* top of the line cards which always cost about $400-$500, today you pay $600 for "trash cards" which didn't make it into production for Titan due to sub-par chips. Nvidia:"Hey, let's just make-up a new card and sell those chips too, lols"
Please AMD, help us!!
bds71 - Friday, May 24, 2013 - link
for what it's worth, I would have like to have seen the 780 *truly* fill the gap between the 680 and titan by offering not only the gaming performance, but ALSO the compute performance - if they would have done a 1/6 or even 1/12!! to better fill the gap and round out the performance all around I would HAPPILY pay 650 for this card. as it is, I already have a 690, so I will simply get another for 4k gaming - but a comparison between 3x 780's and 2 690's (both very close to $2k) at 8Mpixels+ resolution would be extremely interesting. note: 3x 30" monitors could easily be configured for 4800x2560 resolution via NVidia surround or eyefinity - and I, for one, would love to see THAT review!!flexy - Friday, May 24, 2013 - link
Well compute performance is the other thing, along with their questionable GPU throttle aka "boost" (yeah right) technology. Paying premium for such a card and then weak compute performance in exchange compared to older gen cards or the AMD offerings... Seriously, there is a lot to not like about Kepler, at least from an enthusiast point of view. I hope that NV doesn't continue that route in the future with their cards becoming less attractive while prices go up.EJS1980 - Wednesday, May 29, 2013 - link
Cynical much?ChefJeff789 - Friday, May 24, 2013 - link
Glad to see the significant upgrade. I just hope that AMD forces the prices back down again soon. I hope the AMD release "at the end of the year" is closer to September than December. It'll be interesting to see how they stack up. BTW, I have shied away from AMD cards ever since I owned an X800 and had SERIOUS issues with the catalyst drivers (constant blue-screens, had to do a Windows clean-install to even get the card working for longer than a few minutes). I know this was a long time ago, and I've heard from numerous people that they're better now. Is this true?