NVIDIA GeForce GTX 780 Review: The New High End
by Ryan Smith on May 23, 2013 9:00 AM ESTDiRT: Showdown
As always, starting off our benchmark collection is our racing benchmark, DiRT: Showdown. DiRT: Showdown is based on the latest iteration of Codemasters’ EGO engine, which has continually evolved over the years to add more advanced rendering features. It was one of the first games to implement tessellation, and also one of the first games to implement a DirectCompute based forward-rendering compatible lighting system. At the same time as Codemasters is by far the most prevalent PC racing developers, it’s also a good proxy for some of the other racing games on the market like F1 and GRID.
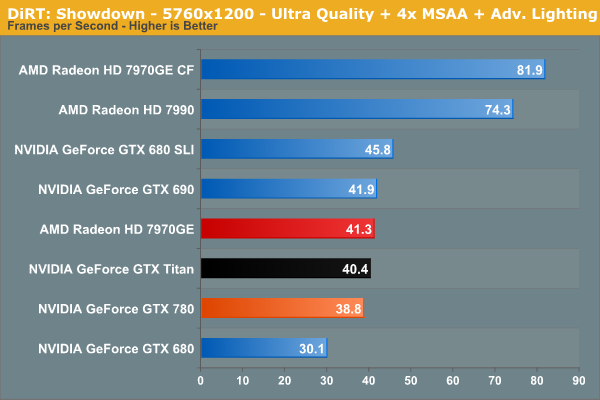
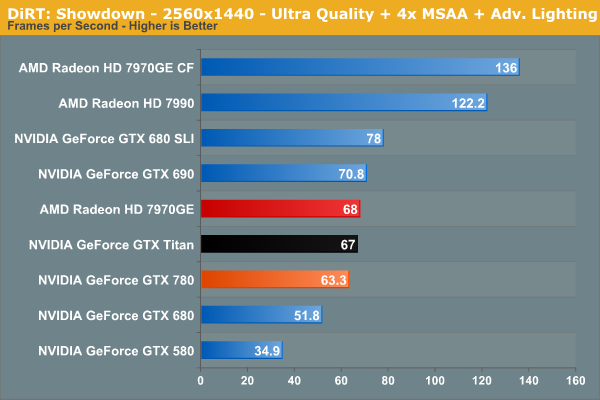
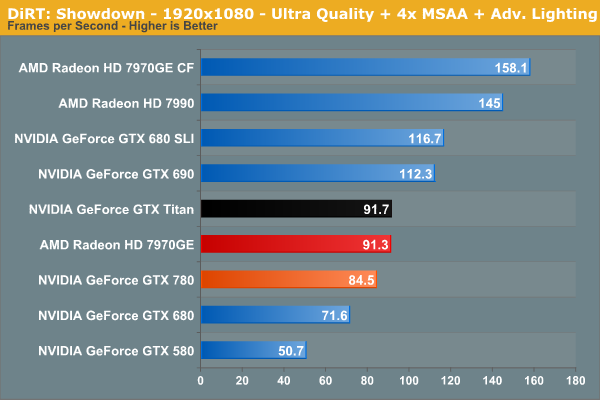
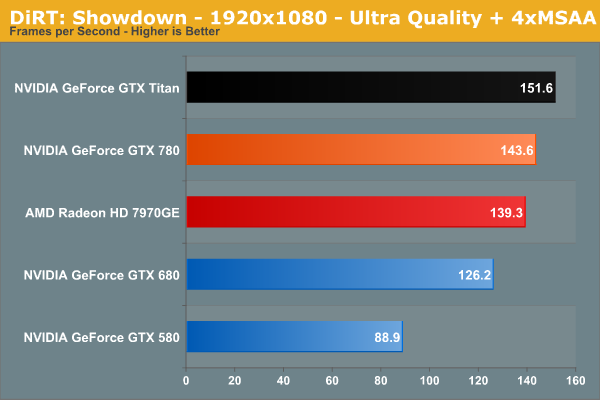
DiRT: Showdown’s lighting system continues to befuddle us at times. Though GK10x Kepler parts generally have mediocre compute performance in pure compute tasks, NVIDIA’s DirectCompute performance has otherwise proven to be appropriately fast, except in the case of DiRT. The fact of the matter is that DiRT is easy enough to run even with its advanced lighting system that there’s no reason not to use it on a card like the GTX 780 at any single-monitor resolution, but doing so does put the GTX 780 in a bad light relative to AMD’s best cards. Nor does this put GK110 in a particularly good light, as its compute enhancements don’t bring it much of an advantage here beyond what the larger number of shaders affords.
Like Titan before it, the GTX 780 falls slightly behind AMD’s Radeon HD 7970 GHz Edition, the only such benchmark where this occurs. The end result being that the GTX 780 trails the 7970GE by about 7%, and the GTX Titan by 6%. Otherwise we’ve seen Titan (and will see GTX 780) do much better in virtually every other benchmark.


155 Comments
View All Comments
littlebitstrouds - Thursday, May 23, 2013 - link
Being a system builder for video editors, I'd love to get some video rendering performance numbers.TheRealArdrid - Thursday, May 23, 2013 - link
The performance numbers on Far Cry 3 really show just how poorly Crysis was coded. There's no reason why new top-end hardware should still struggle on a 6 year old game.zella05 - Thursday, May 23, 2013 - link
Just no. crysis looks way better than farcry 3. dont forget, crysis is a pc game, farcry is a console portRyan Smith - Thursday, May 23, 2013 - link
On a side note, I like Far Cry 3, but I'd caution against using it as a baseline for a well forming game. It's an unusually fussy game. We have to disable HT to make it behave, and the frame pacing even on single GPU cards is more variable than what we see in most other games.zella05 - Thursday, May 23, 2013 - link
there has to be something wrong with your testing? how on earth can 2560x1440 only shave 1fps of all those cards? impossible. I have dual 580s on a dell 1440p monitor and I can say with complete conviction that when playing Crysis 3 you lose at LEAST 10% frame rate. Explain yourselves?WeaselITB - Thursday, May 23, 2013 - link
There are two 1080p graphs -- one "High Quality" and one "Very High Quality" ... the 1440p graph is "High Quality."Comparing HQ between the two gives 79.4 to 53.1 for the 780 ... seems about right to me.
-Weasel
BrightCandle - Thursday, May 23, 2013 - link
Both of your measures taken from FCAT have issues which I will try to explain below.1) The issue with the 95% point
If we take a game where 5% of the frames are being produced very inconsistently then the 95% point wont capture the issue. But worse is the fact that a 1 in 100 frame that takes twice as long is very noticeable when playing to everyone. Just 1% of the frames having an issue is enough to see a noticeable problem. Our eyes don't work by taking 95% of the frames, our eyes require a level of consistency on all frames. Thus the 95% point is not the eqvuialent of minimum FPS, that would be the 100% point. The 95% point is arbitary and ultimately not based on how we perceive the smoothness of frames. It captures AMDs current crossfire issue but it fails to have the resolution necessary as a metric to capture the general problem and compare single cards.
2) The issue with the delta averaging
By comparing to the average frame time this method would incorrectly categorise clearly better performing cards. Its the same mistake Tomshardware made. In essence if you have a game and sometimes that game is CPU limited (common) and then GPU limited the two graphics cards will show similar frame rates at some moments and the faster of them will show dramatically higher performance at other times. This makes the swing from the minimum/average to the high fps much wider. But it could be a perfectly consistent experience in the sense that frame to frame for the most part the variation is minimal. Your calculation would tell us the variation of the faster card was a problem, when actually it wasn't.
The reason that measure isn't right is that it fails to recognise the thing we humans see as a problem. We have issue with individual frames that take a long time. We also have issues with inconsistent delivery of animation in patterns. If we take 45 fps for example the 16/32/16/32 pattern that can produce in vsync is highly noticeable. The issue is that frame to frame we are seeing variation. This is why all the other review sites show the frame times, because the stuttering on a frame by frame basis really matters.
We don't particularly have issues with a single momentary jump up or down in frame rate, we might notice them but its momentary and then we adapt rapidly. What our brains do not adapt to rapidly is continuous patterns of odd delivery of frames. Thus any measure where you try to reduce the amount of data needs to be based on that moment by moment variation between individual or small numbers of frames, because big jumps up and down in fps that last for 10s of seconds are not a problem, the issue is the 10ms swing between two individual frames that keeps happening. You could look for patterns, you could use signal frequency analysis and various other techniques to tune out the "carrier" signal of the underlying FPS. But what you can't do is compare it to the average, that just blurs the entire picture. A game that started at 30 fps for half the trace and then was 60 fps for half the trace with no other variation is vastly better than one that continuously oscillates between 30 and 60 fps every other frame.
Its also important to understand that you analysis is missing fraps. Fraps isn't necessarily good for measuring what the cards are doing but it is essentially the best current way to measure what the game engine is doing. The GPU is impacting on the game simulation and its timing and variation in this affects what goes into the frames. So while FCAT captures if the frames come out smoothly it does not tell us anything about whether the contents is at the right time, fraps is what does that. NVidia is downplaying that tool because they have FCAT and are trying to show off their frame metering and AMD is downplaying it because their cards have issues but it is still a crucial measure. The ideal picture is both that the fraps times are consistent and the FCAT measures are consistent, they after all measure the input into the GPU and the output and we need both to get a true picture of the sub component.
Thus I am of the opinion your data doesn't currently show what you thought it did and your analysis needs work.
rscsrAT - Thursday, May 23, 2013 - link
As far as I understood the delta averaging, it adds the time difference between two adjacent frames.To make it clear, if you have 6 frames with 16/32/16/32/16/32ms per frame, you would calculate the value with (5*16)/((3*16+3*32)/6)=333%.
But if you have 6 framse with 16/16/16/32/32/32ms per frame, you would have 16/((3*16+3*32)/6)=67%.
Therefore you still have a higher value for a higher fluctuating framerate than with a steady framerate.
WeaselITB - Thursday, May 23, 2013 - link
For your #1 -- 95th percentile is a pretty common statistical analysis tool http://en.wikipedia.org/wiki/68-95-99.7_rule ... I'm assuming that they're assuming a normal distribution, which intuitively makes sense given that you'd expect most results to be close to the mean. I'd be interested in seeing the 3-sigma values, as that would further point out the extreme outliers, and would probably satisfy your desire for the "1%" as well.For your #2 -- they're measuring what you're describing, the differences between individual frametimes. Compare their graphs on the "Our First FCAT" page between the line graph of the frametimes of the cards and the bar graph after they massaged the data. The 7970GE has the smallest delta percentage, and the tightest line graph. The 7990 has the largest delta percentage (by far), and the line graph is all over the place. Their methodology of coming up with the "delta percentage" difference is sound.
-Weasel
jonjonjonj - Thursday, May 23, 2013 - link
amd get your act together so we have some competition. i really don't even see the point to this card at this price. what are they going to do for the 770? sell and even more crippled GK110 for $550? and the 760ti will be $450? or are they just going to sell the the 680 as a 770?