NVIDIA GeForce GTX 780 Review: The New High End
by Ryan Smith on May 23, 2013 9:00 AM ESTMeet The GeForce GTX 780, Cont
With all of that said, GTX 780 does make one notable deviation from GTX Titan. NVIDIA has changed their stock fan programming for GTX 780, essentially slowing down the fan response time to even out fluctuations in fan speeds. NVIDIA has told us that they’ve found that next to loud fans in general, the second most important factor in fan noise becoming noticeable is rapidly changing fan speeds, with the changing pitch and volume drawing attention to the card. Slowing down the response time in turn will in theory keep the fan speed from spiking so much, or quickly dropping (i.e. loading screen) only to have to immediately jump back up again.

In our experience fan response times haven’t been an issue with Titan or past NVIDIA cards, and we’d be hard pressed to tell the difference between GTX 780 and Titan. With that said there’s nothing to lose from this change, GTX 780 doesn’t seem to be in any way worse for it, so in our eyes there’s no reason for NVIDIA not to go ahead with the change.
On that note, since this is purely a software(BIOS) change, we asked NVIDIA about whether this could be backported to the hardware equivalent Titan. The answer is fundamentally yes, but because NVIDIA doesn’t have a backup BIOS system, they aren’t keen on using BIOS flashing any more than necessary. So an official (or even unofficial) update from NVIDIA is unlikely, but given the user community’s adept BIOS modding skills it’s always possible a 3rd party could accomplish this on their own.
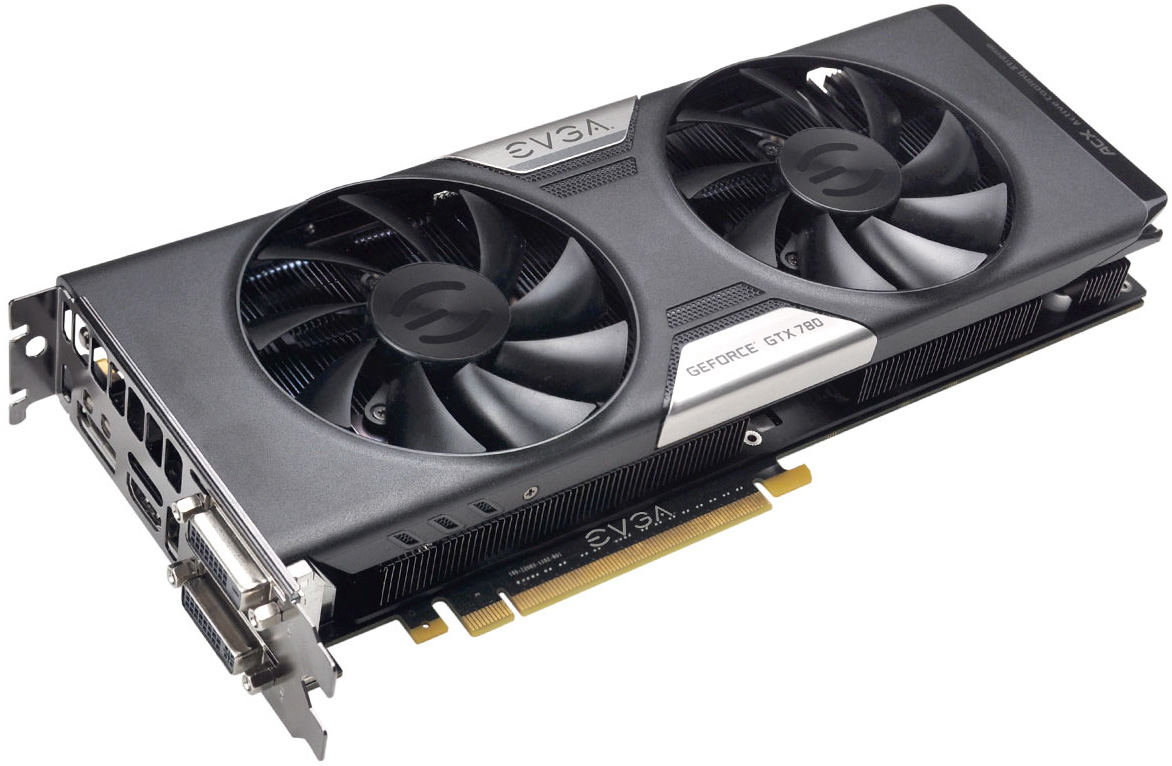
Moving on, unlike Titan and GTX 690, NVIDIA will be allowing partners to customize GTX 780, making this the first line of GK110 cards to allow customization. Potential buyers that were for whatever reason disinterested in Titan due to its blower will find that NVIDIA’s partners are already putting together more traditional open air cooler coolers for GTX 780. We can’t share any data about them yet – today is all about the reference card – but we already have one such card in-hand with EVGA’s GeForce GTX 780 ACX.
The reference GTX 780 sets a very high bar in terms of build quality and performance, so it will be interesting to see what NVIDIA’s partners can come up with. With NVIDIA testing and approving all designs under their Greenlight program, all custom cards have to meet or beat NVIDIA’s reference card in factors such as noise and power delivery, which for GTX 780 will not be an easy feat. However because of this requirement it means NVIDIA’s partners can deviate from NVIDIA’s reference design without buyers needing to be concerned that custom cards are significantly worse than then reference cards, something that benefits NVIDIA’s partners by their being able to attest to the quality of their products (“it got through Greenlight”), and benefitting buyers by letting them know they’re getting something that will be as good as the reference GTX 780, regardless of the specific make or model.
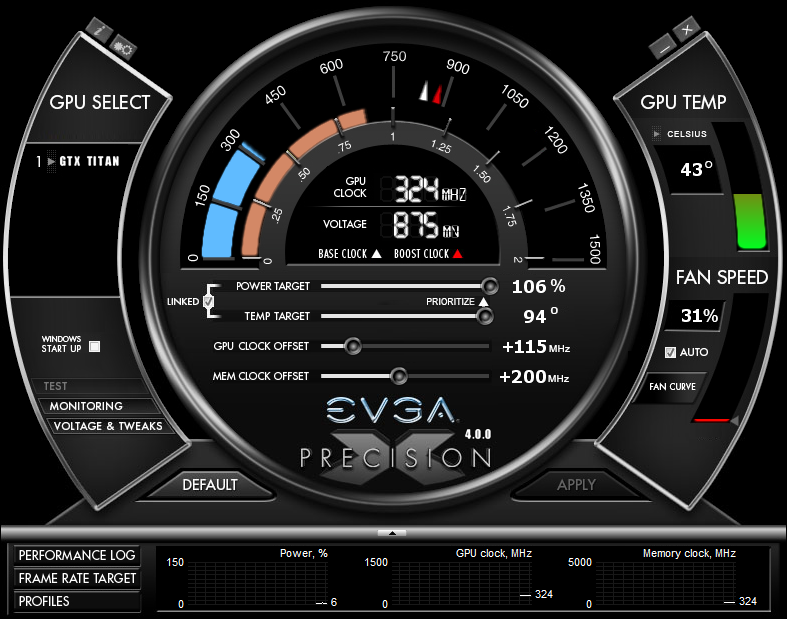
On that note, since we’re talking about card construction let’s quickly dive into overclocking. Overclocking is essentially unchanged from GTX Titan, especially since everything so far is using the reference PCB. The maximum power target remains at 106% (265W) and the maximum temperature target remains at 95C. Buyers will be able to adjust these as they please through Precision X and other tools, but no more than they already could on Titan, which means overclocking is fairly locked down.
Overvolting is also supported in a Titan-like manner, and once again is at the discretion of the card’s partner. By default GTX 780 has a maximum voltage of 1.1625v, with approved overvolting allowing the card to be pushed to 1.2v. This comes in the form of higher boost bins, so enabling overvolting is equivalent to unlocking a +13MHz bin and a +26MHz bin and their requisite voltages. However this also means that those voltages aren’t typically reached with overclocking and overvolting only has a minimal effect, as most overclocking attempts are going to hit TDP limits before they hit the unlocked boost bins.
| GeForce Clockspeed Bins | ||||
| Clockspeed | GTX Titan | GTX 780 | ||
| 1032MHz | N/A | 1.2v | ||
| 1019MHz | 1.2v | 1.175v | ||
| 1006MHz | 1.175v | 1.1625v | ||
| 992MHz | 1.1625v | 1.15v | ||
| 979MHz | 1.15v | 1.137v | ||
| 966MHz | 1.137v | 1.125v | ||
| 953MHz | 1.125v | 1.112v | ||
| 940MHz | 1.112v | 1.1v | ||
| 927MHz | 1.1v | 1.087v | ||
| 914MHz | 1.087v | 1.075v | ||


155 Comments
View All Comments
littlebitstrouds - Thursday, May 23, 2013 - link
Being a system builder for video editors, I'd love to get some video rendering performance numbers.TheRealArdrid - Thursday, May 23, 2013 - link
The performance numbers on Far Cry 3 really show just how poorly Crysis was coded. There's no reason why new top-end hardware should still struggle on a 6 year old game.zella05 - Thursday, May 23, 2013 - link
Just no. crysis looks way better than farcry 3. dont forget, crysis is a pc game, farcry is a console portRyan Smith - Thursday, May 23, 2013 - link
On a side note, I like Far Cry 3, but I'd caution against using it as a baseline for a well forming game. It's an unusually fussy game. We have to disable HT to make it behave, and the frame pacing even on single GPU cards is more variable than what we see in most other games.zella05 - Thursday, May 23, 2013 - link
there has to be something wrong with your testing? how on earth can 2560x1440 only shave 1fps of all those cards? impossible. I have dual 580s on a dell 1440p monitor and I can say with complete conviction that when playing Crysis 3 you lose at LEAST 10% frame rate. Explain yourselves?WeaselITB - Thursday, May 23, 2013 - link
There are two 1080p graphs -- one "High Quality" and one "Very High Quality" ... the 1440p graph is "High Quality."Comparing HQ between the two gives 79.4 to 53.1 for the 780 ... seems about right to me.
-Weasel
BrightCandle - Thursday, May 23, 2013 - link
Both of your measures taken from FCAT have issues which I will try to explain below.1) The issue with the 95% point
If we take a game where 5% of the frames are being produced very inconsistently then the 95% point wont capture the issue. But worse is the fact that a 1 in 100 frame that takes twice as long is very noticeable when playing to everyone. Just 1% of the frames having an issue is enough to see a noticeable problem. Our eyes don't work by taking 95% of the frames, our eyes require a level of consistency on all frames. Thus the 95% point is not the eqvuialent of minimum FPS, that would be the 100% point. The 95% point is arbitary and ultimately not based on how we perceive the smoothness of frames. It captures AMDs current crossfire issue but it fails to have the resolution necessary as a metric to capture the general problem and compare single cards.
2) The issue with the delta averaging
By comparing to the average frame time this method would incorrectly categorise clearly better performing cards. Its the same mistake Tomshardware made. In essence if you have a game and sometimes that game is CPU limited (common) and then GPU limited the two graphics cards will show similar frame rates at some moments and the faster of them will show dramatically higher performance at other times. This makes the swing from the minimum/average to the high fps much wider. But it could be a perfectly consistent experience in the sense that frame to frame for the most part the variation is minimal. Your calculation would tell us the variation of the faster card was a problem, when actually it wasn't.
The reason that measure isn't right is that it fails to recognise the thing we humans see as a problem. We have issue with individual frames that take a long time. We also have issues with inconsistent delivery of animation in patterns. If we take 45 fps for example the 16/32/16/32 pattern that can produce in vsync is highly noticeable. The issue is that frame to frame we are seeing variation. This is why all the other review sites show the frame times, because the stuttering on a frame by frame basis really matters.
We don't particularly have issues with a single momentary jump up or down in frame rate, we might notice them but its momentary and then we adapt rapidly. What our brains do not adapt to rapidly is continuous patterns of odd delivery of frames. Thus any measure where you try to reduce the amount of data needs to be based on that moment by moment variation between individual or small numbers of frames, because big jumps up and down in fps that last for 10s of seconds are not a problem, the issue is the 10ms swing between two individual frames that keeps happening. You could look for patterns, you could use signal frequency analysis and various other techniques to tune out the "carrier" signal of the underlying FPS. But what you can't do is compare it to the average, that just blurs the entire picture. A game that started at 30 fps for half the trace and then was 60 fps for half the trace with no other variation is vastly better than one that continuously oscillates between 30 and 60 fps every other frame.
Its also important to understand that you analysis is missing fraps. Fraps isn't necessarily good for measuring what the cards are doing but it is essentially the best current way to measure what the game engine is doing. The GPU is impacting on the game simulation and its timing and variation in this affects what goes into the frames. So while FCAT captures if the frames come out smoothly it does not tell us anything about whether the contents is at the right time, fraps is what does that. NVidia is downplaying that tool because they have FCAT and are trying to show off their frame metering and AMD is downplaying it because their cards have issues but it is still a crucial measure. The ideal picture is both that the fraps times are consistent and the FCAT measures are consistent, they after all measure the input into the GPU and the output and we need both to get a true picture of the sub component.
Thus I am of the opinion your data doesn't currently show what you thought it did and your analysis needs work.
rscsrAT - Thursday, May 23, 2013 - link
As far as I understood the delta averaging, it adds the time difference between two adjacent frames.To make it clear, if you have 6 frames with 16/32/16/32/16/32ms per frame, you would calculate the value with (5*16)/((3*16+3*32)/6)=333%.
But if you have 6 framse with 16/16/16/32/32/32ms per frame, you would have 16/((3*16+3*32)/6)=67%.
Therefore you still have a higher value for a higher fluctuating framerate than with a steady framerate.
WeaselITB - Thursday, May 23, 2013 - link
For your #1 -- 95th percentile is a pretty common statistical analysis tool http://en.wikipedia.org/wiki/68-95-99.7_rule ... I'm assuming that they're assuming a normal distribution, which intuitively makes sense given that you'd expect most results to be close to the mean. I'd be interested in seeing the 3-sigma values, as that would further point out the extreme outliers, and would probably satisfy your desire for the "1%" as well.For your #2 -- they're measuring what you're describing, the differences between individual frametimes. Compare their graphs on the "Our First FCAT" page between the line graph of the frametimes of the cards and the bar graph after they massaged the data. The 7970GE has the smallest delta percentage, and the tightest line graph. The 7990 has the largest delta percentage (by far), and the line graph is all over the place. Their methodology of coming up with the "delta percentage" difference is sound.
-Weasel
jonjonjonj - Thursday, May 23, 2013 - link
amd get your act together so we have some competition. i really don't even see the point to this card at this price. what are they going to do for the 770? sell and even more crippled GK110 for $550? and the 760ti will be $450? or are they just going to sell the the 680 as a 770?