NVIDIA GeForce GTX 780 Review: The New High End
by Ryan Smith on May 23, 2013 9:00 AM ESTOur First FCAT & The Test
First announced back at the end of March, FCAT has been something of a bewildering experience for us. NVIDIA has actually done a great job on the software, but between picky games, flaky DVI cables, and dead SSDs (we killed an Intel enterprise grade SSD 910 with FCAT) things have not gone quite to plan, pushing back our intended use of FCAT more than once. In any case, with most of the kinks worked out we’re ready to start integrating it into our major GPU reviews.
For the time being we’re putting FCAT on beta status, as we intend to try out a few different methods of presenting data to find something that’s meaningful, useful, and legible. To that end we’d love to get your feedback in our comments section so that we can further iterate on our presentation and data collection.
We’ve decided to go with two metrics for our first run with FCAT. The first metric is rather simple: 95th percentile frametimes. For years we’ve done minimum framerates (when practical), which are similar in concept, so this allows us to collect similar stats at the end of the rendering pipeline while hopefully avoiding some of the quirkiness that comes from looking at minimum framerates within games themselves. The 95th percentile frametime is quite simply the amount of time it takes to render the slowest 5% of frames. If a game or video card is introducing significant one-off stuttering by taking too long to render some frames, this will show us.
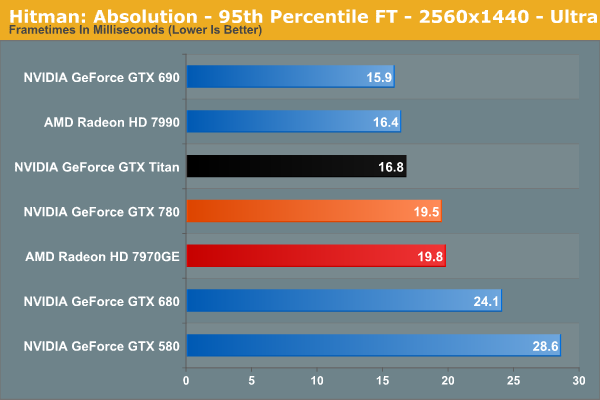
This is primarily meant to capture single-GPU issues, but in practice with AMD having fixed the bulk of their single-GPU issues months ago, we don’t actually expect much. None the less it’s a good way of showing that nothing interesting is happening in those situations.
Our second metric is primarily focused on multi-GPU setups, and is an attempt to quantize the wild frametime variations seen at times with multi-GPU setups, which show up as telltale zigzag lines in frametime graphs.
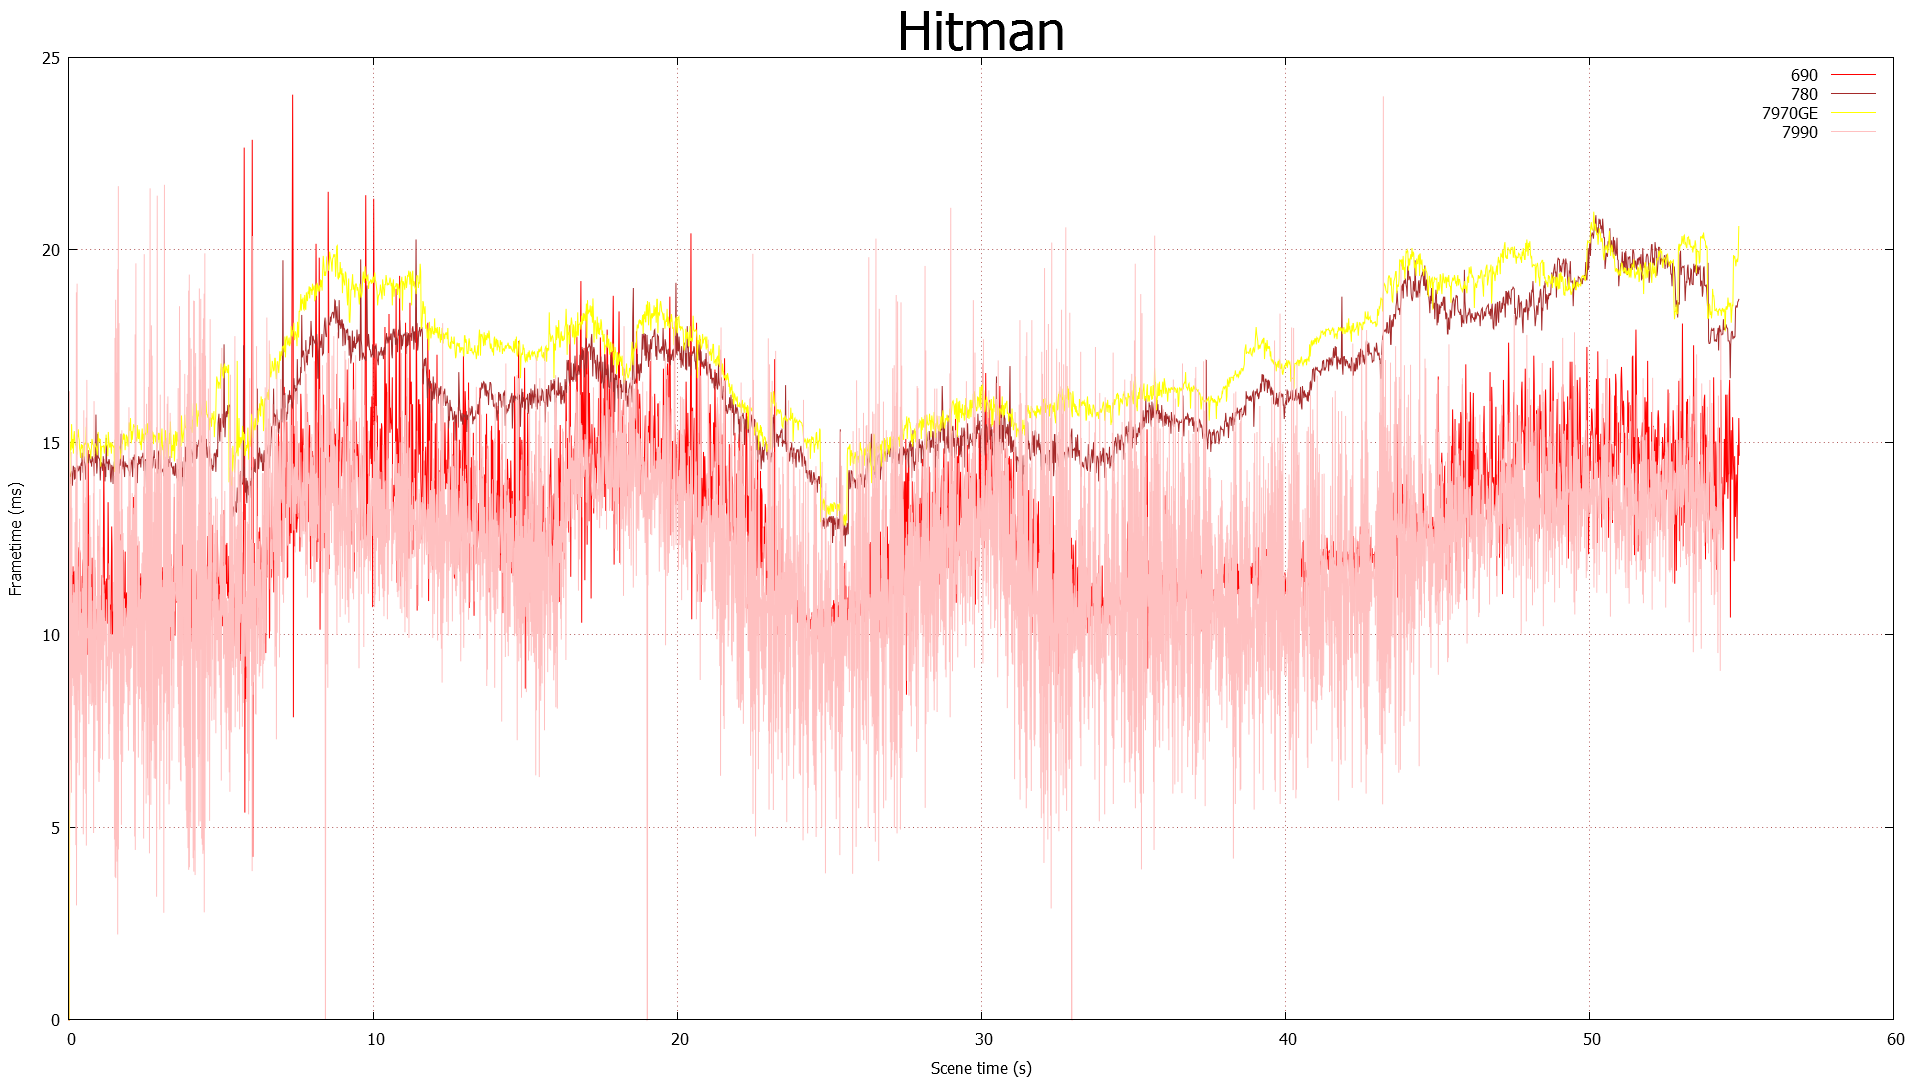
In this metric, which for the moment we’re calling Delta Percentages, we’re collecting the deltas (differences) between frametimes, averaging that out, and then running the delta average against the average frametime of the entire run. The end result of this process is that we can measure whether sequential frames are rendering in roughly the same amount of time, while controlling for performance differences by looking at the data relative to the average frametime (rather than as absolute time).
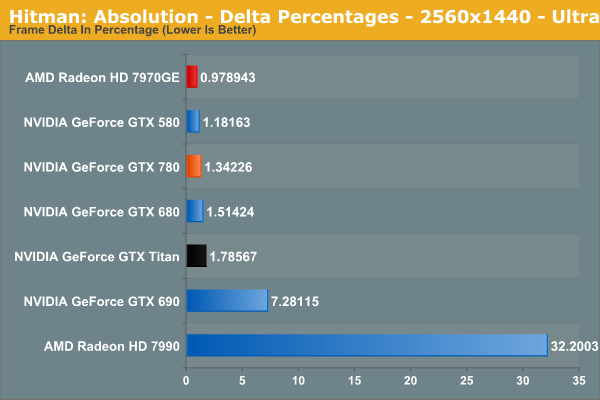
In general, a properly behaving single-GPU card should have a delta average of under 3%, with the specific value depending in part on how variable the workload is throughout any given game benchmark. 3% may sound small, but since we’re talking about an average it means it’s weighed against the entire run. The higher the percentage the more unevenly frames are arriving, and exceeding 3% is about where we expect players with good eyes to start noticing a difference. Alternatively in a perfectly frame metered situation, such as v-sync enabled with a setup that can always hit 60fps, then this would be a flat 0%, representing the pinnacle of smoothness.
Moving on, we’ll be running FCAT against 6 of our 10 games for the time being: Sleeping Dogs, Hitman: Absolution, Total War: Shogun 2, Battlefield 3, Bioshock, and Crysis 3. The rest of our games are either highly inconsistent or generally fussy, introducing too much variance into our FCAT results.
Finally, due to the amount of additional time it takes to put together FCAT results, we’re going to primarily publish FCAT results with major product launches and major driver updates. Due to how frame metering works, the only time frame consistency significantly changes is either with the introduction of new architectures/GPUs, or with the introduction of significant driver changes, so those are the scenarios we’ll be focusing on.
The Test
NVIDIA’s launch drivers for the GTX 780 are 320.18, drivers that are essentially identical to the public 320.14 drivers released last week.
| CPU: | Intel Core i7-3960X @ 4.3GHz |
| Motherboard: | EVGA X79 SLI |
| Power Supply: | Antec True Power Quattro 1200 |
| Hard Disk: | Samsung 470 (256GB) |
| Memory: | G.Skill Ripjaws DDR3-1867 4 x 4GB (8-10-9-26) |
| Case: | Thermaltake Spedo Advance |
| Monitor: | Samsung 305T |
| Video Cards: |
AMD Radeon HD 7970 GHz Edition AMD Radeon HD 7990 NVIDIA GeForce GTX 580 NVIDIA GeForce GTX 680 NVIDIA GeForce GTX 690 NVIDIA GeForce GTX 780 NVIDIA GeForce GTX Titan |
| Video Drivers: |
NVIDIA ForceWare 320.14 NVIDIA ForceWare 320.18 AMD Catalyst 13.5 Beta 2 |
| OS: | Windows 8 Pro |


155 Comments
View All Comments
just4U - Thursday, May 23, 2013 - link
I love the fact that their using the cooler they used for the Titan. While I plan to wait (no need to upgrade right now) I'd like to see more of that.. It's a feature I'd pay for from both Nvidia and Amd.HalloweenJack - Thursday, May 23, 2013 - link
no compute with the GTX 780 - the DP is similar to a GTX 480 and way way down on a 7970. no folding on these thenBiffaZ - Friday, May 24, 2013 - link
Folding doesn't use DP currently, its SP, same for most @home type compute apps, the main exclusion being Milkyway@Home which needs DP alot.boe - Thursday, May 23, 2013 - link
Bring on the DirectCU version and I'll order 2 today!slickr - Thursday, May 23, 2013 - link
At $650 its way too expensive. Two years ago this card would have been $500 at launch and within 4-5 months it would have been $400 with the slower cut down version at $300 and mid range cards $200.I hope people aren't stupid to buy this overpriced card that only brings about 5fps more than AMD top end single card.
chizow - Thursday, May 23, 2013 - link
I think if it launched last year, it's price would have been more justified, but Nvidia sat on it for a year while they propped up mid-range GK104 as flagship. Very disappointing.Measured on it's own merits, GTX 780 is very impressive and probably worth the increase over previous flagship price points. For example, it's generally 80% faster than GTX 580, almost 100% faster than GTX 480, it's predecessors. In the past the increase might only be ~60-75% and improve some with driver gains. It also adds some bling and improvements with the cooler.
It's just too late imo for Nvidia to ask those kinds of prices, especially after lying to their fanbase about GK104 always slotted as Kepler flagship.
JPForums - Thursday, May 23, 2013 - link
I love what you are doing with frame time deltas. Some sites don't quite seem to understand that you can maintain low maximum frame times while still introducing stutter (especially in the simulation time counter) by having large deltas between frames. In the worst case, your simulation time can slow down (or speed up) while your frame time moves back in the opposite direction exaggerating the result.Admittedly I may be misunderstanding your method as I'm much more accustomed to seeing algebraic equations describing the method, but assuming I get it, I'd like to suggest further modification to you method to deal with performance swings that occur expectedly (transition to/from cut-scenes, arrival/departure of graphically intense elements, etc.). Rather than compare the average of the delta between frames against an average frame time across the entire run, you could compare instantaneous frame time against a sliding window average. The window could be large for games with consistent performance and smaller for games with mood swings. Using percentages when comparing against the average frame times for the entire run can result in situations where two graphics solutions with the exact same deltas would show the one with better performance having worse deltas. As an example, take any video cards frame time graph and subtract 5ms from each frame time and compare the two resulting delta percentages. A sliding window accounts for natural performance deviations while still giving a baseline to compare frame times swings from. If you are dead set on percentages, you can take them from there as the delta percentages from local frame time averages are more relevant than the delta percentage from the runs overall average. Given my love of number manipulation, though, I'd still prefer to see the absolute frame time difference from the sliding window average. It would make it much easier for me to see whether the difference to the windowed average is large (lets say >15ms) or small (say <4ms). Of course, while I'm being demanding, it would be nice to get an xls, csv, or some other format of file with the absolute frame times so I can run whatever graph I want to see myself. I won't hold my breath. Take some of my suggestions, all of them, or none of them. I'm just happy to see where things are going.
Arnulf - Thursday, May 23, 2013 - link
The correct metric for this comparison would be die size (area) and complexity of manufacturing rather than the number of transistors.RAM modules contain far more transistors (at least a couple of transistors per bit, with common 4 GB = 32 Gb = 64+ billion transistors per stick modules selling for less than $30 on Newegg), yet cost peanuts compared to this overpriced abomination that is 780.
marc1000 - Thursday, May 23, 2013 - link
and GTX 760 ??? what will it be? will it be $200??or maybe the 660 will be rebranded as 750 and go to $150??
kilkennycat - Thursday, May 23, 2013 - link
Fyi: eVGA offers "Superclocked" versions of the GTX780 with either a eVGA-designed "ACX" dual-open-fan cooler, or the nVidia-designed "titan"blower. Both at $659 are ~ $10 more than the default-speed version. The overclocks are quite substantial, 941MHz base, 993MHz boost (vs default 863/902) for the "titan" blower version, 967/1020 for the ACX-cooler version. The ACX cooler is likely to be more noisy than the "titan", plus it will dump some exhaust heat back into the computer case. Both of these eVGa Superclocked types were available for a short time on Newegg this morning, now "Auto Notify" :-( :-(