Choosing a Gaming CPU: Single + Multi-GPU at 1440p, April 2013
by Ian Cutress on May 8, 2013 10:00 AM ESTCPU Benchmarks
Point Calculations - 3D Movement Algorithm Test
The algorithms in 3DPM employ both uniform random number generation or normal distribution random number generation, and vary in amounts of trigonometric operations, conditional statements, generation and rejection, fused operations, etc. The benchmark runs through six algorithms for a specified number of particles and steps, and calculates the speed of each algorithm, then sums them all for a final score. This is an example of a real world situation that a computational scientist may find themselves in, rather than a pure synthetic benchmark. The benchmark is also parallel between particles simulated, and we test the single threaded performance as well as the multi-threaded performance.
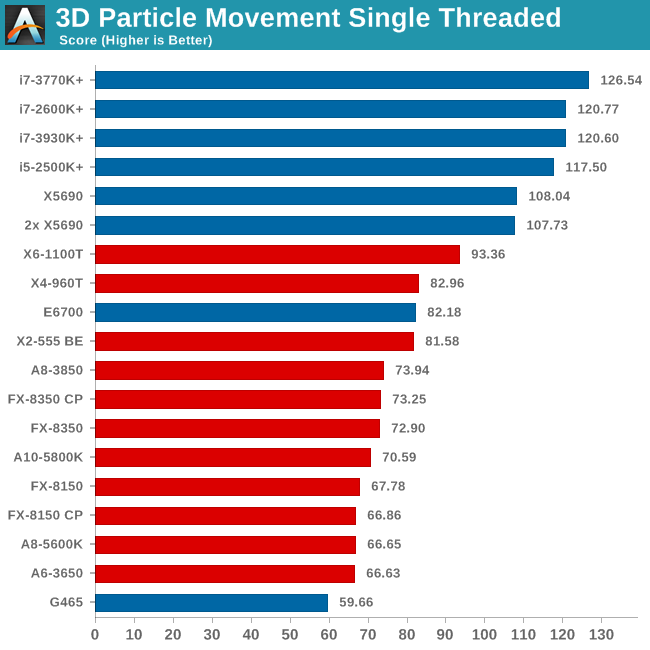
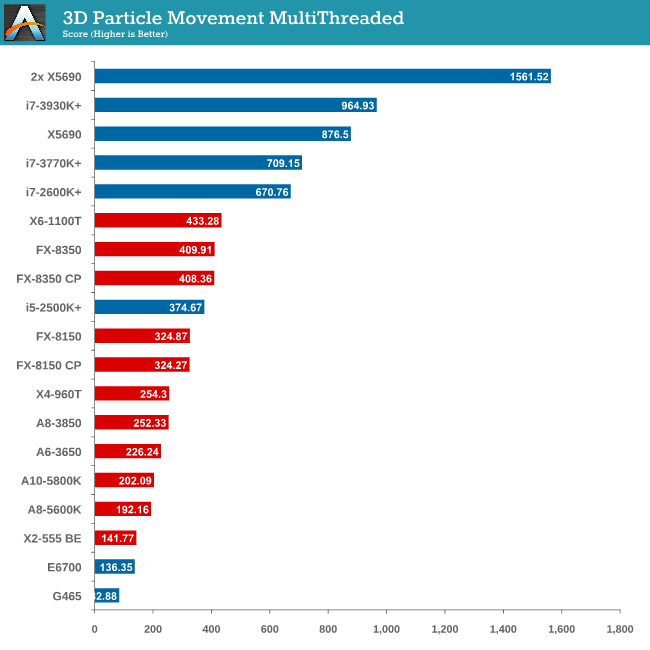
As mentioned in previous reviews, this benchmark is written how most people would tackle the situation – using floating point numbers. This is also where Intel excels, compared to AMD’s decision to move more towards INT ops (such as hashing), which is typically linked to optimized code or normal OS behavior.
Compression - WinRAR x64 3.93 + WinRAR 4.2
With 64-bit WinRAR, we compress the set of files used in our motherboard USB speed tests. WinRAR x64 3.93 attempts to use multithreading when possible and provides a good test for when a system has variable threaded load. WinRAR 4.2 does this a lot better! If a system has multiple speeds to invoke at different loading, the switching between those speeds will determine how well the system will do.
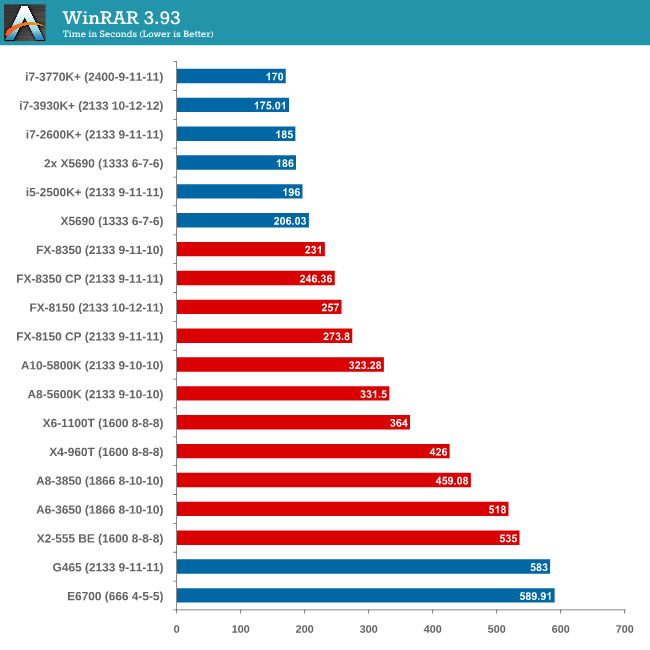
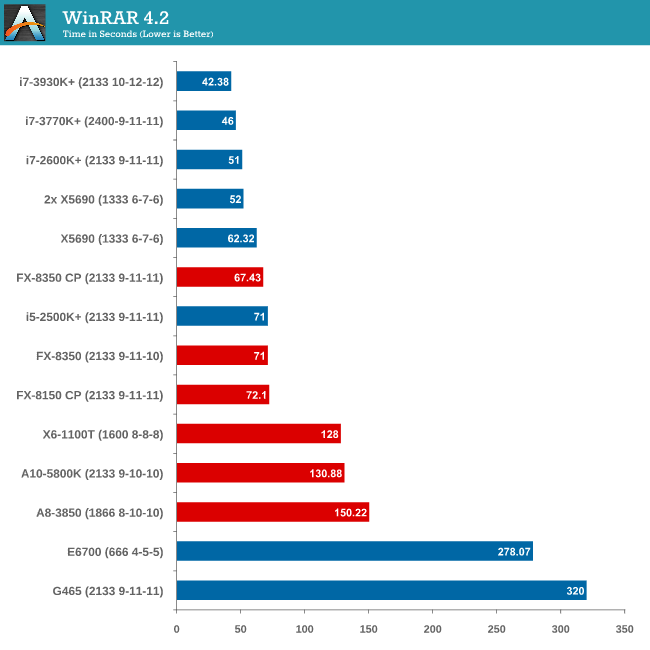
Due to the late inclusion of 4.2, our results list for it is a little smaller than I would have hoped. But it is interesting to note that with the Core Parking updates, an FX-8350 overtakes an i5-2500K with MCT.
Image Manipulation - FastStone Image Viewer 4.2
FastStone Image Viewer is a free piece of software I have been using for quite a few years now. It allows quick viewing of flat images, as well as resizing, changing color depth, adding simple text or simple filters. It also has a bulk image conversion tool, which we use here. The software currently operates only in single-thread mode, which should change in later versions of the software. For this test, we convert a series of 170 files, of various resolutions, dimensions and types (of a total size of 163MB), all to the .gif format of 640x480 dimensions.
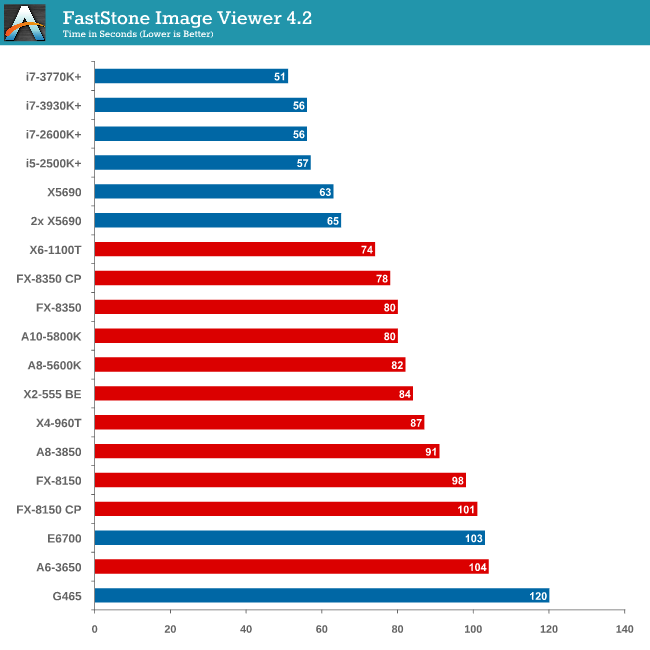
In terms of pure single thread speed, it is worth noting the X6-1100T is leading the AMD pack.
Video Conversion - Xilisoft Video Converter 7
With XVC, users can convert any type of normal video to any compatible format for smartphones, tablets and other devices. By default, it uses all available threads on the system, and in the presence of appropriate graphics cards, can utilize CUDA for NVIDIA GPUs as well as AMD WinAPP for AMD GPUs. For this test, we use a set of 33 HD videos, each lasting 30 seconds, and convert them from 1080p to an iPod H.264 video format using just the CPU. The time taken to convert these videos gives us our result.
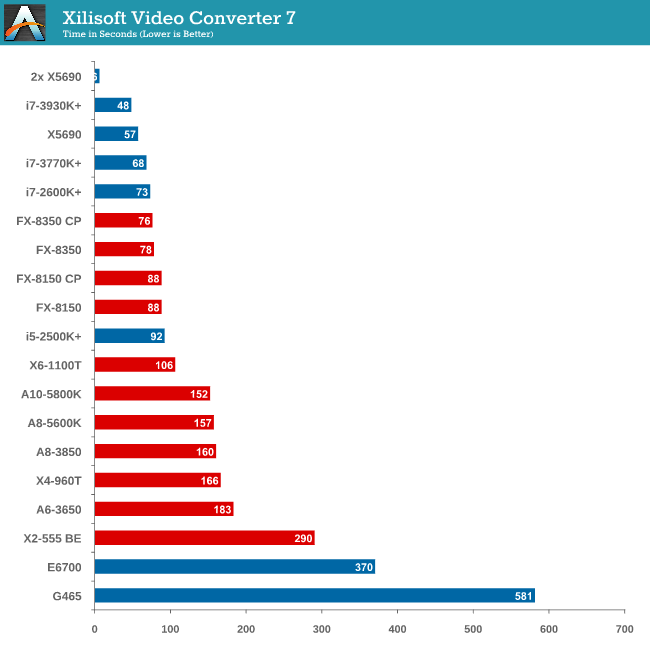
XVC is a little odd in how it arranges its multicore processing. For our set of 33 videos, it will arrange them in batches of threads – so if we take the 8 thread FX-8350, it will arrange the videos into 4 batches of 8, and then a fifth batch of one. That final batch will only have one thread assigned to it (!), and will not get a full 8 threads worth of power. This is also why the 2x X5690 finishes in 6 seconds but the normal X5690 takes longer – you would expect a halving of time moving to two CPUs but XVC arranges the batches such that there is always one at the end that only gets a single thread.
Rendering – PovRay 3.7
The Persistence of Vision RayTracer, or PovRay, is a freeware package for as the name suggests, ray tracing. It is a pure renderer, rather than modeling software, but the latest beta version contains a handy benchmark for stressing all processing threads on a platform. We have been using this test in motherboard reviews to test memory stability at various CPU speeds to good effect – if it passes the test, the IMC in the CPU is stable for a given CPU speed. As a CPU test, it runs for approximately 2-3 minutes on high end platforms.
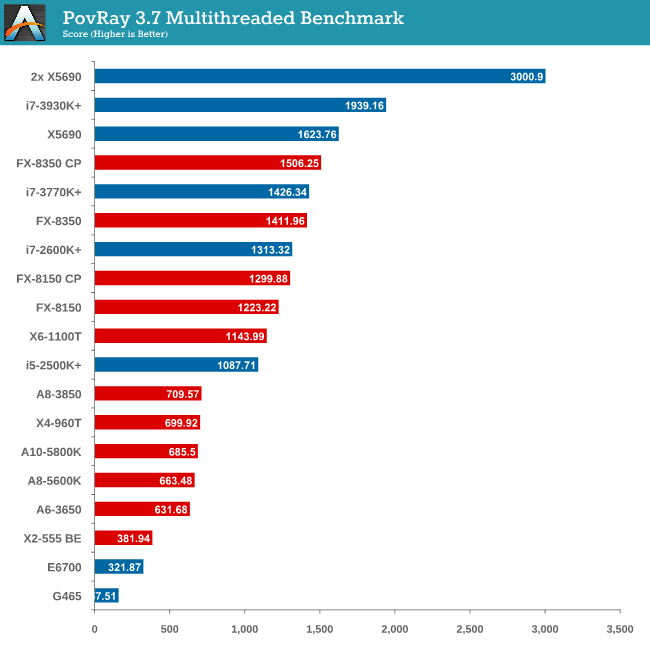
The SMP engine in PovRay is not perfect, though scaling up in CPUs gives almost a 2x effect. The results from this test are great – here we see an FX-8350 CPU below an i7-3770K (with MCT), until the Core Parking updates are applied, meaning the FX-8350 performs better!
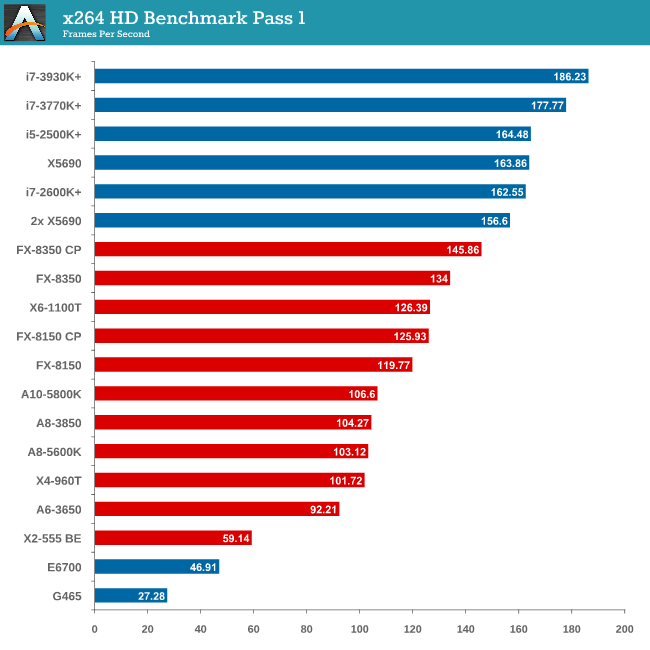
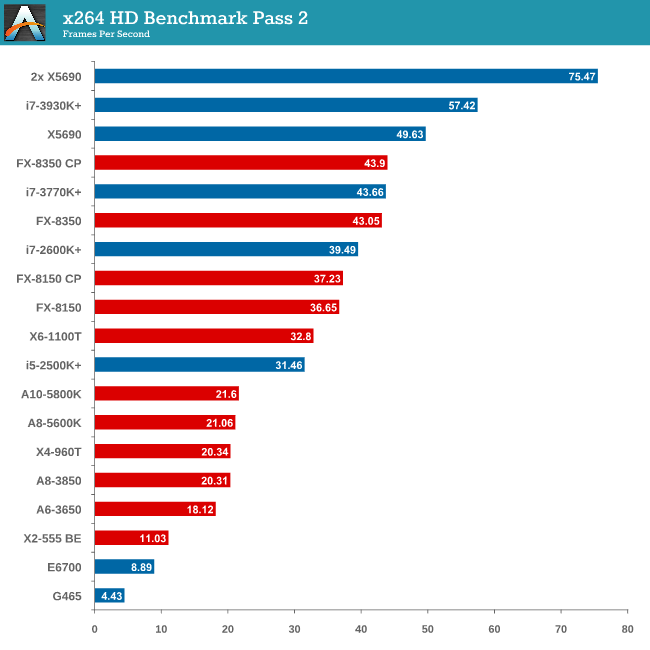
Video Conversion - x264 HD Benchmark
The x264 HD Benchmark uses a common HD encoding tool to process an HD MPEG2 source at 1280x720 at 3963 Kbps. This test represents a standardized result which can be compared across other reviews, and is dependent on both CPU power and memory speed. The benchmark performs a 2-pass encode, and the results shown are the average of each pass performed four times.
Grid Solvers - Explicit Finite Difference
For any grid of regular nodes, the simplest way to calculate the next time step is to use the values of those around it. This makes for easy mathematics and parallel simulation, as each node calculated is only dependent on the previous time step, not the nodes around it on the current calculated time step. By choosing a regular grid, we reduce the levels of memory access required for irregular grids. We test both 2D and 3D explicit finite difference simulations with 2n nodes in each dimension, using OpenMP as the threading operator in single precision. The grid is isotropic and the boundary conditions are sinks. Values are floating point, with memory cache sizes and speeds playing a part in the overall score.
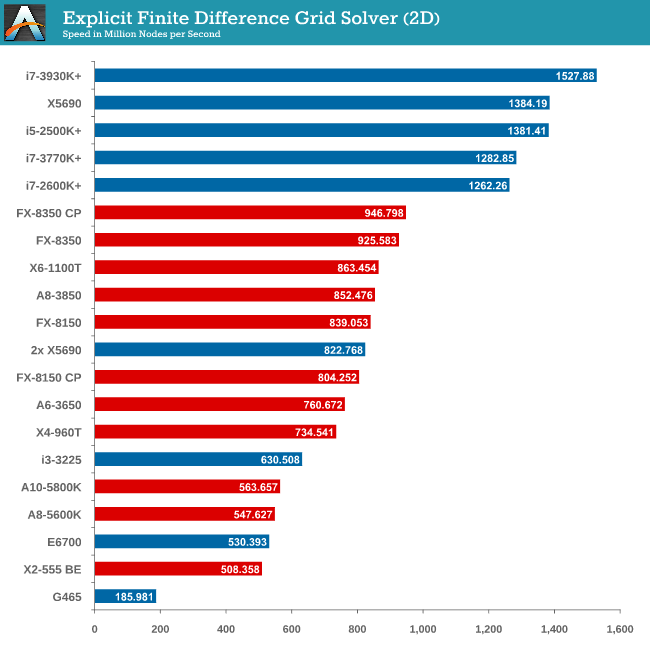

Grid solvers do love a fast processor and plenty of cache in order to store data. When moving up to 3D, it is harder to keep that data within the CPU and spending extra time coding in batches can help throughput. Our simulation takes a very naïve approach in code, using simple operations.
Grid Solvers - Implicit Finite Difference + Alternating Direction Implicit Method
The implicit method takes a different approach to the explicit method – instead of considering one unknown in the new time step to be calculated from known elements in the previous time step, we consider that an old point can influence several new points by way of simultaneous equations. This adds to the complexity of the simulation – the grid of nodes is solved as a series of rows and columns rather than points, reducing the parallel nature of the simulation by a dimension and drastically increasing the memory requirements of each thread. The upside, as noted above, is the less stringent stability rules related to time steps and grid spacing. For this we simulate a 2D grid of 2n nodes in each dimension, using OpenMP in single precision. Again our grid is isotropic with the boundaries acting as sinks. Values are floating point, with memory cache sizes and speeds playing a part in the overall score.
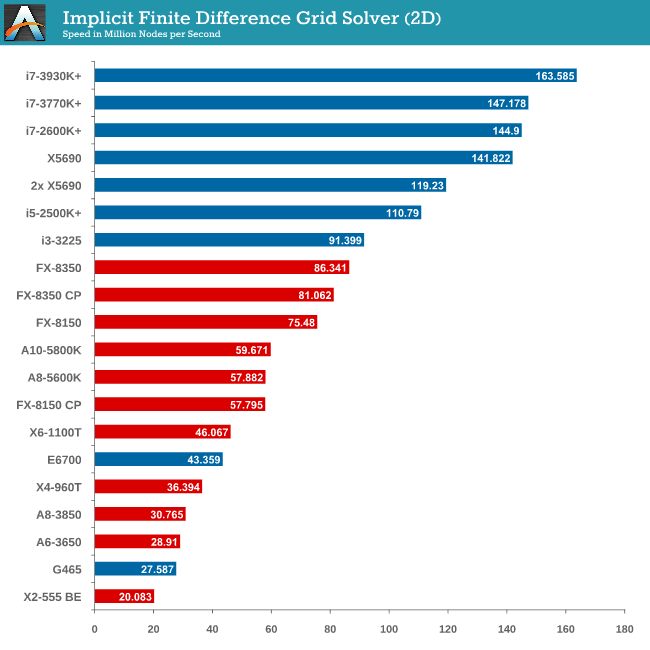
2D Implicit is harsher than an Explicit calculation – each thread needs more a lot memory, which only ever grows as the size of the simulation increases.
Point Calculations - n-Body Simulation
When a series of heavy mass elements are in space, they interact with each other through the force of gravity. Thus when a star cluster forms, the interaction of every large mass with every other large mass defines the speed at which these elements approach each other. When dealing with millions and billions of stars on such a large scale, the movement of each of these stars can be simulated through the physical theorems that describe the interactions. The benchmark detects whether the processor is SSE2 or SSE4 capable, and implements the relative code. We run a simulation of 10240 particles of equal mass - the output for this code is in terms of GFLOPs, and the result recorded was the peak GFLOPs value.
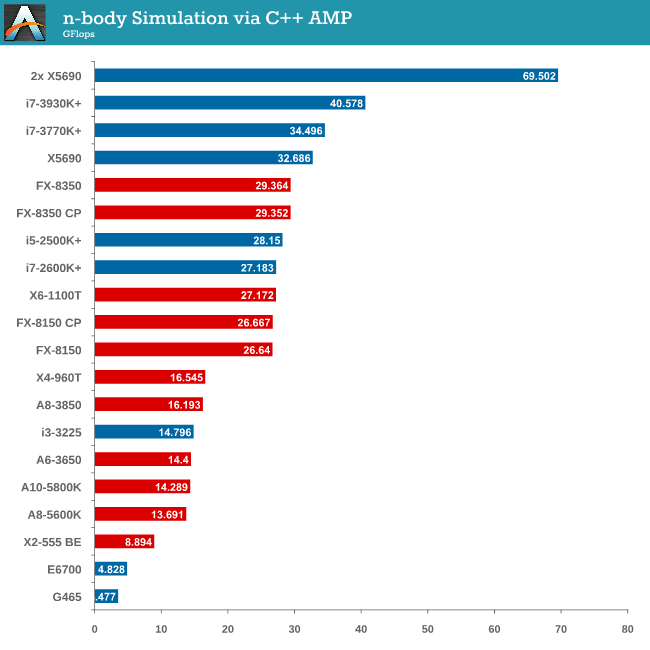
As we only look at base/SSE2/SSE4 depending on the processor (auto-detection), we don’t see full AVX numbers in terms of FLOPs.


242 Comments
View All Comments
TheInternal - Thursday, May 9, 2013 - link
You honestly would be fine running most games at that rez with a single 670. After a driver install, I forgot to turn SLI back on for like a week and didn't really notice much of a difference in most of my games. Two of most high end cards, from what I continue to hear on forums, can easily power three 1080p monitors at high settings as well. I've not been able to find much information for two and three card setups powering three 1440p or higher res monitors though.nvalhalla - Wednesday, May 8, 2013 - link
Request: I've seen a few sites do these and they always use a large GPU. I understand removing the GPU from the equation, focus on the CPUs, but I would like to see these tests done with a 7770. If I'm dropping $1000+ on GPUs, I'm not thinking about buying an $80 CPU. A great question I haven't seen answered is how much CPU do I need for a normal mid-range card? If I am looking to get a mid-range GPU, do I need an i5 3570k? Would an x2 555 provide the same gaming performance? A what point does spending more on the CPU stop providing an improvement in performance?khanov - Wednesday, May 8, 2013 - link
Thanks for the article, interesting read.I'd like to suggest putting the i7 3820 in to the next article. The 3960x and 3930k are both 6 core CPU's, making platform comparison with all the other quad core's in the article more difficult.
Certainly you should retain the 6 core CPU's so we can see their potential, but adding the 3820 would allow for direct comparison of the X79 platform vs other platforms when all are running a quad core CPU.
steve_rogers42 - Thursday, May 9, 2013 - link
Hi Ian, fantastic article, has led me to rethink a lot of things, especially the scaling at work due to PCI-E 3.0 and price performance for low end systems. Seems that low-mid cpu and decent gpu is still the way to roll for future builds.Dont know if it would be possible but it would be interested to see the difference between an SR-2 and an SR-X especially considering the PCI-E 3.0 and move to newer cpu architecture.
Be also nice to see a 980x or 990x x58 or a q6600 to see the benefits of moving up from c2q/d to core i... But you probably don't have time :)
Again great article, has made me rethink original thoughts on AMD's 8350 and the caliber of Anandtech' comment's...
Cheers from Australia.
pandemonium - Thursday, May 9, 2013 - link
I haven't even read the entire article yet, but I can tell it's going to be awesome due to the outlying thoroughness on the first page.Thank you so very much for going well beyond what other reviewers do by just reporting a single run for each setup without delving deeper into the "why". Truly noble; and I would say you can honestly call yourself a scientist. :)
Sabresiberian - Thursday, May 9, 2013 - link
I think anyone reading this article thoroughly will come away with a better sense of how multidimensional the questions about which mainboard, CPU, and GPU to buy are. It isn't just a matter of looking at a few 2D graphs and picking the top solution (though that might serve to get you in the ballpark of what you want).Once again, I come away better educated and with more of a sense of what is going on with hardware combinations. Well done, and thanks! I'm looking forward to more of this type about these subjects.
smuff3758 - Thursday, May 9, 2013 - link
Well said. Finally, a simple thank you.LaxerFL - Thursday, May 9, 2013 - link
I'd like to see an i7-3820 in action, since I have one in this rig right now! I ran the PoVRay benchmark to see where it placed and scored 1626.25. I've OCed my cpu to 4.6Ghz though but I'd still like to see where a stock 3820 places in these benchmarks. I'm also interested to know if Quad Channel memory makes any difference...Great article! Keep it up, I look forward to seeing more results.
SuperVeloce - Thursday, May 9, 2013 - link
Why is there no E6700 on some of the graphs? E6400 in biblically underpowered and under-cached, we already knew that. Quad would be a better comparison anyways, as many still have them for games and productivity. And another thing... is pci-e 1.1 playing any role with those core2duo bad fps numbers? Why not use a P45 or sth with pci-e 2.0?guskline - Thursday, May 9, 2013 - link
Why didn't you use the GTX680? Comparing a Radeon 7970 to a GTX580? Please!