NVIDIA GeForce GTX 650 Ti Boost Review: Bringing Balance To The Force
by Ryan Smith on March 26, 2013 8:00 AM ESTPower, Temperature, & Noise
Last but not least of course is our look at power, temperature, and noise. Because the GTX 650 Ti Boost is essentially a reconfigured GTX 660 there aren’t going to be any grand revelations here, but it will be useful to figure out just what the real-world power savings will be from fusing off that one SMX.
| GeForce GTX 650 Ti Boost Voltages | ||||
| Ref GTX 650 Ti Boost Idle | Ref GTX 650 Ti Boost Load | Ref GTX 660 Load | ||
| 0.887v | 1.175v | 1.175v | ||
With a peak load voltage of 1.175v, the GTX 650 Ti Boost tops out at the same voltage as the rest of the boost-enabled Kepler family.
Up next, before we jump into our graphs let’s take a look at the average core clockspeed during our benchmarks. Because GTX 650 Ti Boost has the same TDP has the GTX 660 but at least marginally lower power consumption due to the disabled SMX, it’s in an interesting position where it has more headroom for boosting than its fully-enabled counterpart. As a result we’re seeing far less variability than what we saw with the GTX 660 when we reviewed it last year. With the exception of BF3, every game is sustained at the top boost bin of 1071MHz. Based on these results it would appear that in practice the GTX 650 Ti Boost operates at a marginally higher average clockspeed than the otherwise superior GTX 660.
| GeForce GTX 650 Ti Boost Average Clockspeeds | |||
| Max Boost Clock | 1071MHz | ||
| DiRT:S |
1071MHz
|
||
| Shogun 2 |
1071MHz
|
||
| Hitman |
1071MHz
|
||
| Sleeping Dogs |
1071MHz
|
||
| Crysis |
1071MHz
|
||
| Far Cry 3 |
1071MHz
|
||
| Battlefield 3 |
1058MHz
|
||
| Civilization V |
1071MHz
|
||
| FurMark | 992MHz | ||
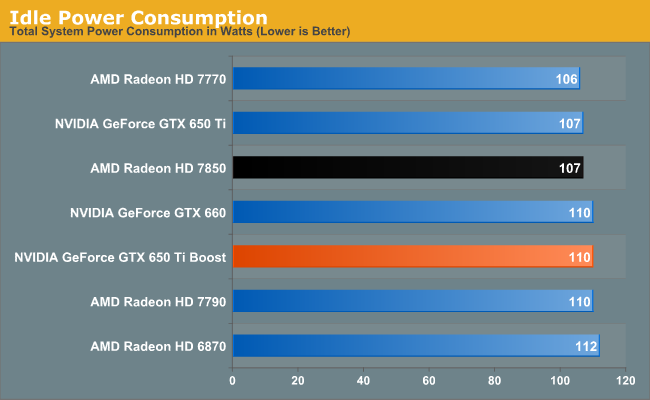
Starting as always with idle power, 110W at idle is par for the course for most NVIDIA cards. With the reactivation of the 3rd ROP partition the GTX 650 Ti Boost gives up the slight advantage the GTX 650 Ti gained here.
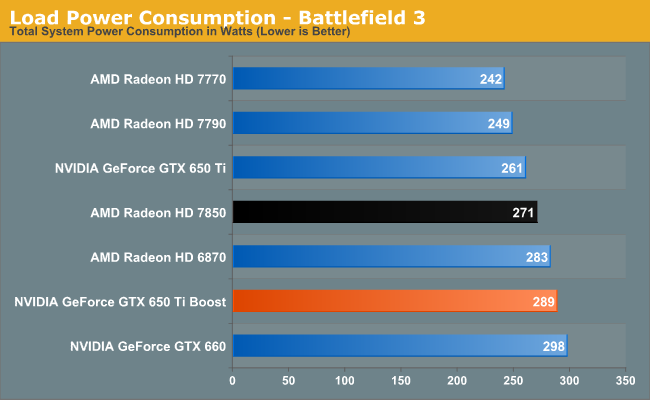
Moving on to our first and arguably most important load power test we have BF3. Power consumption in BF3 scales slightly with performance due to the extra work required of the CPU to feed more frames to a video card, but it usually paints some clear trends and this is no exception. NVIDIA may only be giving the GTX 650 Ti Boost a official TDP 6W lower than the GTX 660, but it’s clear power consumption is at least a little bit lower than that; we’re seeing 289W at the wall versus 298W for the GTX 660. On the other hand these results are 28W higher than the GTX 650 Ti, and even 18W higher than the 7850, never mind the 7790. The GTX 650 Ti Boost’s performance here is well ahead of everything other than the GTX 660, so this jump in power consumption does come with a performance boost, but it serves as a reminder that there is a tradeoff to be made. In the case of the GTX 650 Ti Boost, we’re seeing it pull away a bit from the efficiency curve set by NVIDIA’s other products.
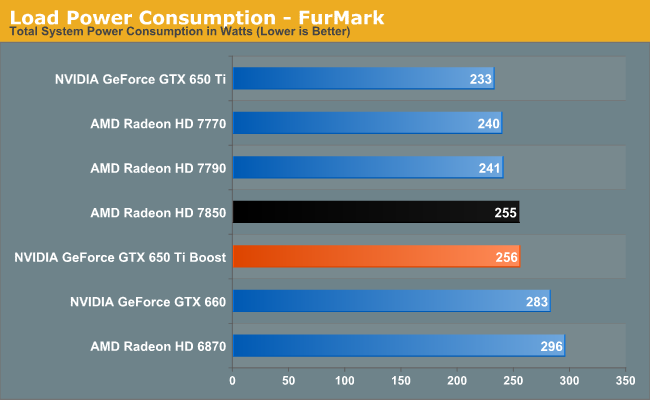
As for power consumption under FurMark, we’re seeing the more muted results for the GTX 650 Ti Boost. Here it’s roughly halfway between the GTX 650 Ti and GTX 660, and probably should be a bit higher still. The fact that there’s a difference (at the wall) of 27W between the GTX 660 and GTX 650 Ti Boost is more than we would except, and more than makes sense for cards that are identical except for a single fused off SMX. So we may also be seeing chip-to-chip variation play a part here. In any case, power consumption is also similar to the 7850, but this is one of those scenarios where we put more faith in the BF3 numbers than the FurMark numbers; NVIDIA appears to just outright be more aggressive on throttling here.
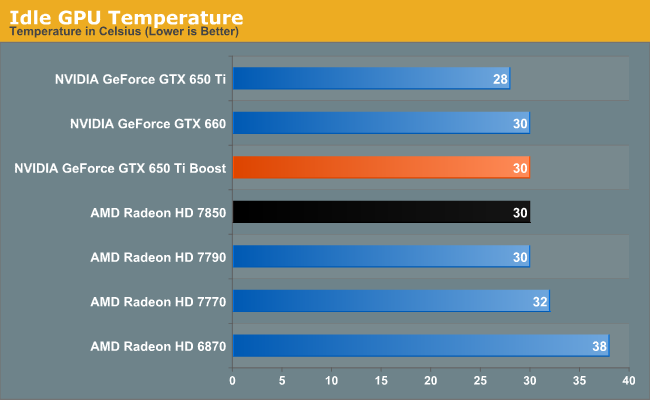
Utilizing the same cooler as the GTX 660, there’s no surprise here in seeing the GTX 650 Ti Boost hit the same 30C idle temperatures.
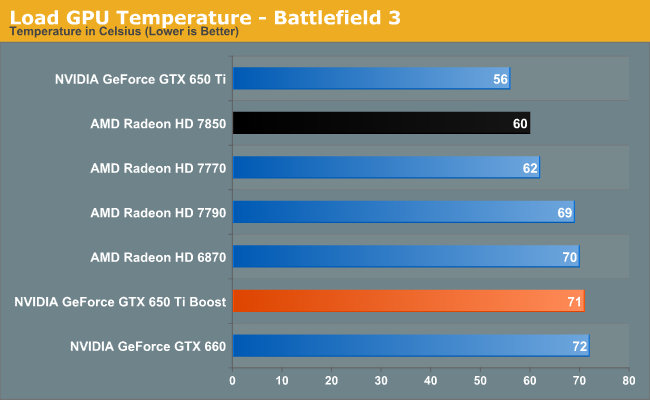
Similarly, our temperature results here closely parallel the GTX 660’s under load. The GTX 650 Ti Boost consumes a bit less power than the GTX 660, and doesn’t get quite as warm as a result. The large jump from the GTX 650 Ti comes as a bit of a shock to the eyes at first, but as the GTX 650 Ti Boost is a blower and one with a conservative fan curve at that, this is to be expected.
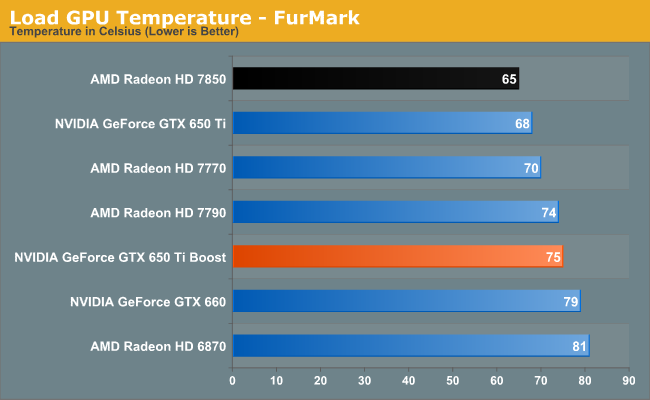
With FurMark we see temperatures go up, but for the most part things are consistent with what we saw under BF3. The larger gap between the GTX 650 Ti Boost and GTX 660 reflects the larger gap in power consumption we saw earlier.
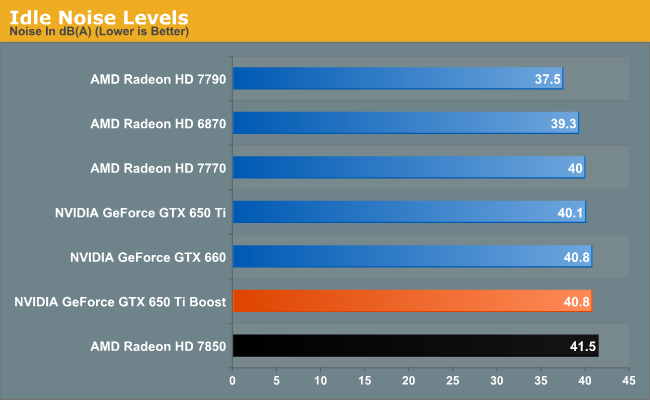
Just as with idle temperatures, the same GPU on the same cooler means we’re looking at the same idle noise temperatures. The blower NVIDIA uses here is quite good, but it can’t compete with simple open-air coolers like the 7790’s.
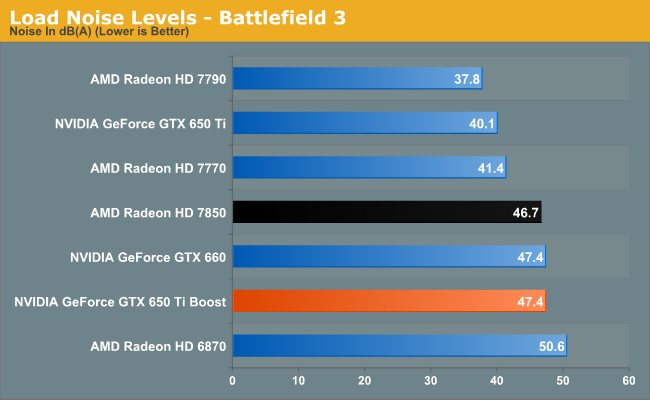
There’s a clear cutoff here between the open-air coolers and the blowers. The GTX 650 Ti Boost is quite a bit faster than something like the 7790 here, but the difference in noise is remarkable. Some of NVIDIA’s partner cards should fare much better here as they pack open-air coolers, with the usual tradeoff of giving up being fully-exhausting coolers. Still, this is a reminder that the GTX 650 Ti Boost pulls back from the efficiency curve a bit; it’s about 15% slower than the GTX 660 but no quieter for it.
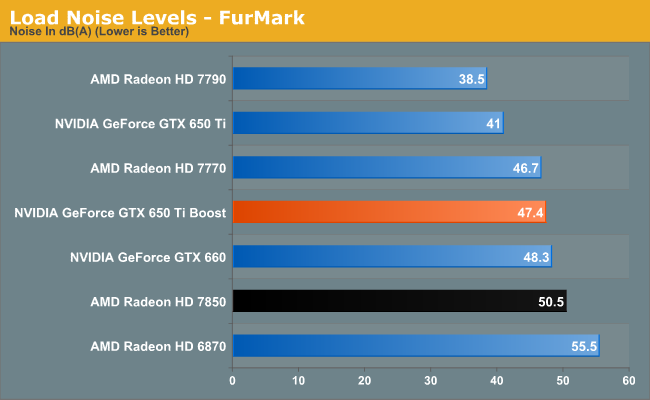
Finally we have load noise under FurMark. NVIDIA’s more aggressive throttling here means that our results don’t jump up to much from BF3. The GTX 650 Ti Boost does finally end up being a bit quieter than the GTX 660 due to the former’s lower power consumption, and this is the only time we see the GTX 650 Ti Boost gain an edge on the 7850 in power/temp/noise.


78 Comments
View All Comments
royalcrown - Thursday, March 28, 2013 - link
yeah, but the $$$ of a 660 is dropping every week, i just dont really see the point of the 650 ti when you have the 650 and 660 and they all have overclocked versions as well. a few places have the 2 gig 660 for $199.00royalcrown - Thursday, March 28, 2013 - link
well, if the new 650 is 149, then I guess that'd be a great price preformance vs the 660. I suppose it depends on what they cost in real life.SAAB_340 - Tuesday, March 26, 2013 - link
Is it just me thinking the 1GB model might be a bad idea given that these cards with the 192bit memory bus have asymetrical memory placement. The card only has 768MB of the memory at full bandwidth while the last 256MB will only give a 3rd of the bandwidth. (it's the same with the 2GB card but there 1.5GB has full bandwidth.) 768MB is not much with todays standards. Looking forward to the test showing how much that will impact on performance.Oxford Guy - Tuesday, March 26, 2013 - link
It's absurd, just like the AMD 1 GB card that was just announced. I've read that Skyrim with high resolution textures needs 2 GB at minimum and I doubt most people consider Skyrim a high-end game.Parhel - Tuesday, March 26, 2013 - link
The high resolution texture pack didn't really affect memory usage that much when I installed it. It was below 1GB both before and after. That's at 2560x1600, no AA. Maybe with mods it's a different story, but I think if you're trying to show where 1GB hits a wall, you'd be better off starting with a different game.mczak - Wednesday, March 27, 2013 - link
Personally I'd think it would make more sense to just have a 1.5GB card (at say right between the 149$ of the 1GB model and the 169$ of the 2GB model). All the same performance characteristics as the 2GB model (as you say the those asymmetric configurations are a little dubious or at least suspect anyway) while being cheaper. But marketing doesn't like 1.5GB cards (and as intended competitor of 7850 2GB of course "looks" much better).drew_afx - Wednesday, March 27, 2013 - link
How about Performance per dollar(retail) comparison for these very similarly spec'd cards?Make up some metric for 3d games(dx9/10/11), encoding/decoding, OpenCL, etc
Because a lot of games are CPU intensive, for potential buyers, FPS comparison on a specific benchmarking setup is not going to reflect equally in real life.
Also if a game can run 60+min. fps & maybe 75fps avg., then the card is as good as it can get for average people. This comparison proves X is better than Y when used with top of the line CPU Mobo RAM combo, but thats it. Many don't go for $2000+ gaming computer setup and put sub $170 GPU in it. What about overclocking potential? It's like comparing non-K cpu to unlocked one (just to put it in a perspective)
CiccioB - Wednesday, March 27, 2013 - link
Still, the game list is quite obsolete.It is not time to replace Crysis: warhead with Crysis3 and Dirt: Showdown with Dirt3?
And adding Skyrim? Last Tomb Raider?
Gamers would like to know how today games run on these cards, not only if one GPU is faster than another playing ancient games with obsolete engines.
This thing has already been pointed out during Titan's review. There someone suggested that games choice has been made to review games that are better on AMD rather than nvidia GPUs.
However, no answer was made, either to give reasons on why so many old obsolete games or whether the list was going to be changed/enlarged.
Still, new games are not considered for no apparent reason.
After having spent so many efforts in upgrading the site's appearance, which I like very much, it would be nice also to spend a bit of time to make a new game benchmark suite. It's 2013 and many games have been published after Crysis: warhead and Dirt: showdown.
Thanks in advance
Ryan Smith - Friday, March 29, 2013 - link
We'll be adding two more games next month (or whenever I can find the time to validate them). Crysis: Warhead isn't going anywhere since it's our one legacy title for comparing DX10 cards to. And DiRT: Showdown is newer than DiRT 3, not older. It was Showdown that we replaced 3 with. Skyrim was also removed, since it's badly CPU limited on higher-end cards.medi01 - Wednesday, March 27, 2013 - link
Any reason 7850 and not 7790 (direct competitor) is marked black?