Plextor M5M (256GB) mSATA Review
by Kristian Vättö on April 17, 2013 10:20 AM ESTRandom Read/Write Speed
The four corners of SSD performance are as follows: random read, random write, sequential read and sequential write speed. Random accesses are generally small in size, while sequential accesses tend to be larger and thus we have the four Iometer tests we use in all of our reviews.
Our first test writes 4KB in a completely random pattern over an 8GB space of the drive to simulate the sort of random access that you'd see on an OS drive (even this is more stressful than a normal desktop user would see). I perform three concurrent IOs and run the test for 3 minutes. The results reported are in average MB/s over the entire time. We use both standard pseudo randomly generated data for each write as well as fully random data to show you both the maximum and minimum performance offered by SandForce based drives in these tests. The average performance of SF drives will likely be somewhere in between the two values for each drive you see in the graphs. For an understanding of why this matters, read our original SandForce article.
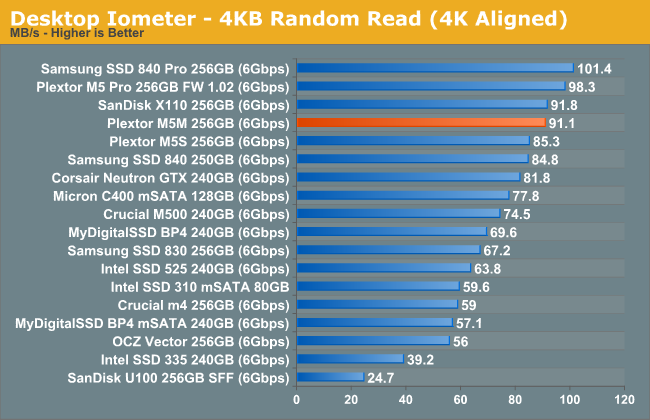
Random read performance is strong and nearly on par with the M5 Pro. However, at queue depth of 3 there is no substantial benefit from the increased parallelism with eight channels, hence the M5M is able to keep up.
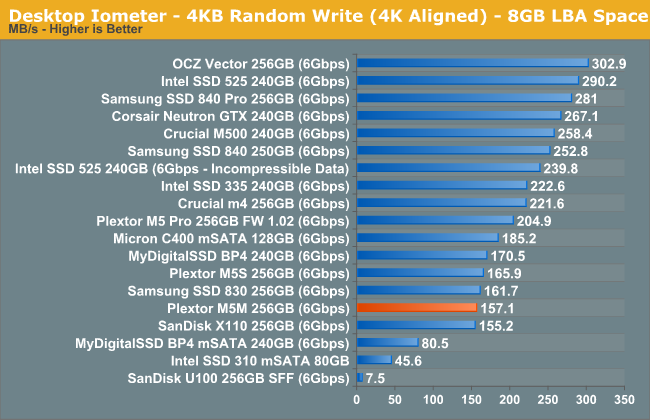
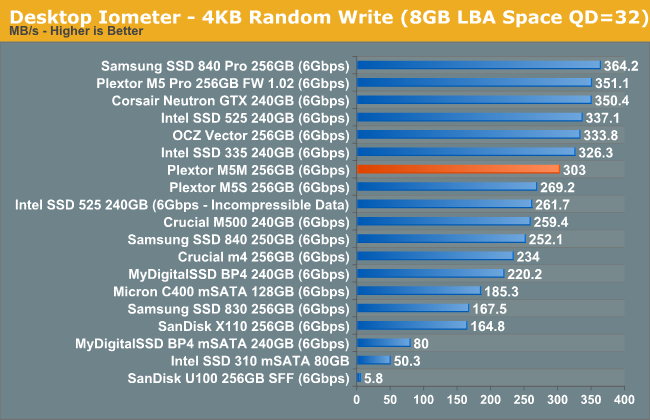
Random write speed at lower queue depths has never been Plextor's biggest advantage and the M5M is no exception. The performance is not terrible but it's behind compared to many of the other today's high-end SSDs. However, at higher queue depths the performance raises to a level similar to other SSDs:
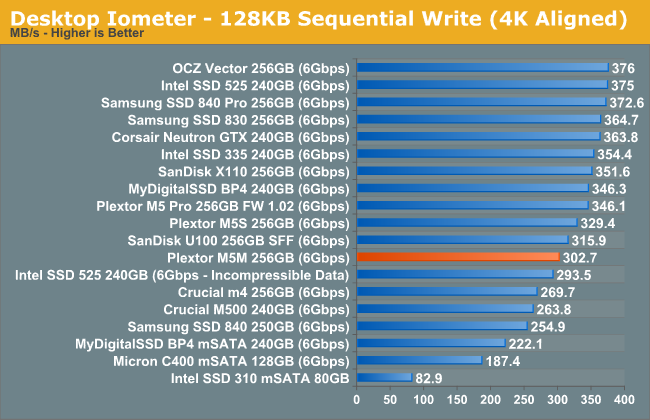
Sequential Read/Write Speed
To measure sequential performance I ran a 1 minute long 128KB sequential test over the entire span of the drive at a queue depth of 1. The results reported are in average MB/s over the entire test length.
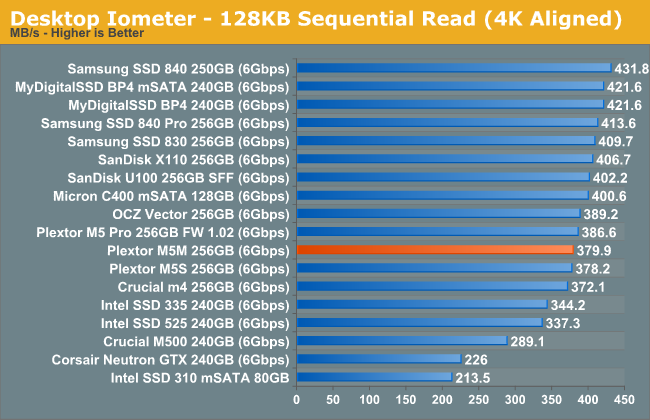
Sequential write speed is slightly lower than what you get with all eight channels populated, but the difference isn't dramatic.
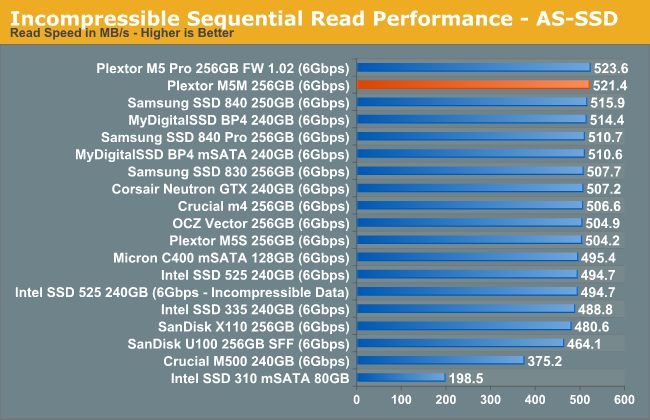
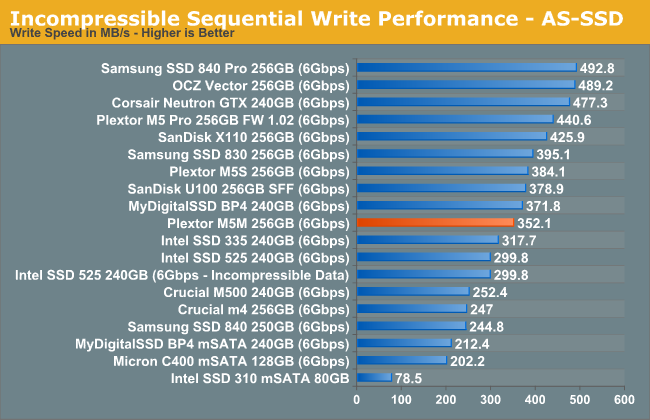
AS-SSD Incompressible Sequential Performance
The AS-SSD sequential benchmark uses incompressible data for all of its transfers. The result is a pretty big reduction in sequential write speed on SandForce based controllers.


36 Comments
View All Comments
JPForums - Thursday, April 18, 2013 - link
Sorry, I wasn't trying to bait you. The posts just came off as a little hostile. Probably a result of the my morning meetings.If I'm understanding you correctly, your biggest issue is with the method of consistency. I read in another of your posts that this method is similar to the tests that several large enterprises use. You seem to be familiar with these methods. Is there an alternate (better) method in use that Anandtech could be using? Alternately do you have a superior method in mind that isn't currently in use? I'm guessing (for starters) you'd be happier with a method that measures individual operation latencies (I would too), but I'm unaware any tools that could accomplish this.
JellyRoll - Thursday, April 18, 2013 - link
The consistency testing and all trace based testing used by this site are tested without partitions or filesystems, and no TRIM functionality. This has been disclosed by the staff in the comment sections of previous reviews.If you are testing consumer hardware, the first order of the day is to use methods that accurately reflect real workloads. Removing the must crucial component required for performance consistency (TRIM), then testing 'consistency' anyway, is ridiculous. Would you test a vehicle without fuel?
Kristian Vättö - Thursday, April 18, 2013 - link
TRIM does not affect performance consistency of a continuous write workload. TRIM will only tell the controller which LBAs are no longer in use - the actual LBAs still need to be erased before new data can be written. When you're constantly writing to the drive, it doesn't have time to erase the blocks as fast as new write requests come in, which causes the performance to sink.If you know methods that "accurately reflect real workloads" then please share them. Pointing out flaws is easy but unhelpful unless you can provide a method that's better.
JellyRoll - Thursday, April 18, 2013 - link
Pasted from the Wiki:"The TRIM command is designed to enable the operating system to notify the SSD which pages no longer contain valid data due to erases either by the user or operating system itself. During a delete operation, the OS will both mark the sectors as free for new data and send a TRIM command to the SSD to be marked as no longer valid. After that the SSD knows not to relocate data from the affected LBAs during garbage collection."
During a pure write workload there is no need for the SSD's internal garbage collection functions to read-write-modify in order to write new data. That is the purpose of TRIM. Without TRIM writes require read-write-modify activity, with TRIM they do not. Very easy to see how it boosts performance.
Kristian Vättö - Thursday, April 18, 2013 - link
You still have to erase the blocks, which is the time consuming part. Again, there's no time for normal idle garbage collection to kick in. Yes, the drive will know what LBAs are no longer in use but it still has to erase the blocks containing those LBAs. If you let the drive idle, then it will have time to reorganize the data so that there'll be enough empty blocks to maintain good performance but that is not the case in a continuous write workload.JellyRoll - Thursday, April 18, 2013 - link
It is removing the 'write' from the read-write-modify cycle. Writing a page smaller than the block requires the SSD to relocate the other data in the block first, adding work for the SSD. Remember, they erase at block level. If it isn't aware that the rest of the block is also invalid (the point of TRIM) it must first move the other data.Kristian Vättö - Thursday, April 18, 2013 - link
It's read-modify-write cycle (read the block to cache, modify the data, write the modified data) so the write operation is still there, otherwise the drive wouldn't complete the write request in the first place. You also seem to be assuming that the rest of the pages in the block are invalid, which is unlikely the case unless we're dealing with an empty drive. Hence it's exactly the same cycle with TRIM as you still have to read at least some of the data and then rewrite it. You may have to read/write less data as some of it will be invalid, but remember that garbage collection (with TRIM off) will also mark pages as invalid on its own. That's the reason why performance will stay high even if TRIM is not supported (e.g. OS X), assuming that the garbage collection is effective (there's at least 7% OP so there is always invalid pages).JellyRoll - Thursday, April 18, 2013 - link
I am not assuming the data is still valid, the SSD does. It has to move the data if it considers it valid. TRIM removes the need to move this 'other' data, thus speeding the drive.Kristian Vättö - Monday, April 22, 2013 - link
Here are some tests I did with Plextor M5 Pro XtremeRAW (no partition): https://dl.dropboxusercontent.com/u/128928769/Cons...
NTFS (default cluster size): https://dl.dropboxusercontent.com/u/128928769/Cons...
As you can see, there's no major difference. In fact, there's a bigger slowdown with NTFS versus raw drive.
JPForums - Thursday, April 18, 2013 - link
1) I was not aware that another website created this method of characterizing performance, but I'll give you the benefit of the doubt. Nonetheless, the statement that Anand introduced it to the standard test suite here at Anandtech in the Intel SSD DC S3700 review is a true statement. Given the context of the original statement, this is more likely the intended interpretation. Out of curiosity, which site did create the method?2) I'm not sure whether or not the test measures individual operation latencies or not as IOPS is basically the inverse of an average of the those latencies over time. It is kind of like the difference between FPS and Frame latencies. That said, the representation on the graphs is more the inverse of a one second sliding window average. Saying as much is kind of a mouthful, though. How would you phrase it?