Gigabyte GA-7PESH1 Review: A Dual Processor Motherboard through a Scientist’s Eyes
by Ian Cutress on January 5, 2013 10:00 AM EST- Posted in
- Motherboards
- Gigabyte
- C602
Many thanks to...
We must thank the following companies for kindly donating hardware for our test bed:
OCZ for donating the Power Supply and USB testing SSD
Micron for donating our SATA testing SSD
Kingston for donating our ECC Memory
ASUS for donating AMD GPUs
ECS for donating NVIDIA GPUs
Test Setup
| Test Setup | |
| Processor |
2x Intel Xeon E5-2690 8 Cores, 16 Threads, 2.9 GHz (3.8 GHz Turbo) each |
| Motherboards | Gigabyte GA-7PESH1 |
| Cooling |
Intel AIO Liquid Cooler Corsair H100 |
| Power Supply | OCZ 1250W Gold ZX Series |
| Memory | Kingston 1600 C11 ECC 8x4GB Kit |
| Memory Settings | 1600 C11 |
| Video Cards |
ASUS HD7970 3GB ECS GTX 580 1536MB |
| Video Drivers |
Catalyst 12.3 NVIDIA Drivers 296.10 WHQL |
| Hard Drive | Corsair Force GT 60 GB (CSSD-F60GBGT-BK) |
| Optical Drive | LG GH22NS50 |
| Case | Open Test Bed - DimasTech V2.5 Easy |
| Operating System | Windows 7 64-bit |
| SATA Testing | Micron RealSSD C300 256GB |
| USB 2/3 Testing | OCZ Vertex 3 240GB with SATA->USB Adaptor |
Power Consumption
Power consumption was tested on the system as a whole with a wall meter connected to the OCZ 1250W power supply, with a single 7970 GPU installed. This power supply is Gold rated, and as I am in the UK on a 230-240 V supply, leads to ~75% efficiency > 50W, and 90%+ efficiency at 250W, which is suitable for both idle and multi-GPU loading. This method of power reading allows us to compare the power management of the UEFI and the board to supply components with power under load, and includes typical PSU losses due to efficiency. These are the real world values that consumers may expect from a typical system (minus the monitor) using this motherboard.
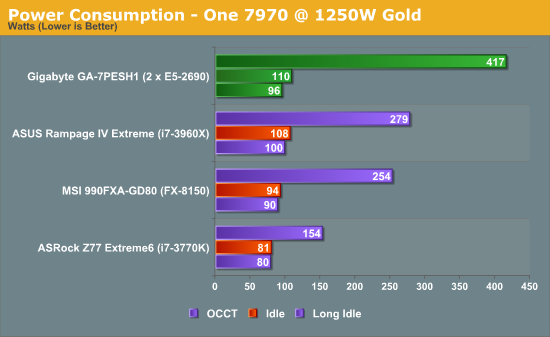
Using two E5-2690 processors would mean a combined TDP of 270W. If we make the broad assumption that the processors combined use 270W under loading, this places the rest of the motherboard at around 110-130W, which is indicated by our idle numbers (despite PSU efficiency).
POST Time
Different motherboards have different POST sequences before an operating system is initialized. A lot of this is dependent on the board itself, and POST boot time is determined by the controllers on board (and the sequence of how those extras are organized). As part of our testing, we are now going to look at the POST Boot Time - this is the time from pressing the ON button on the computer to when Windows starts loading. (We discount Windows loading as it is highly variable given Windows specific features.) These results are subject to human error, so please allow +/- 1 second in these results.
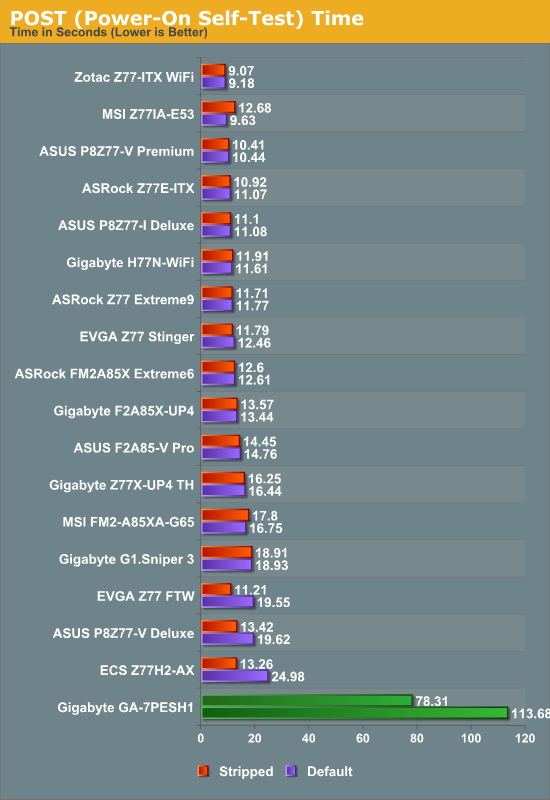
The boot time on this motherboard is a lot longer than anything I have ever experienced. Firstly, when the power supply is switched on, there is a 30 second wait (indicated by a solid green light that turns into a flashing green light) before the motherboard can be switched on. This delay is to enable the management software to be activated. Then, after pressing the power switch, there is around 60 seconds before anything visual comes up on the screen. Due to the use of the Intel NICs, the LSI SAS RAID chips and other functionality, there is another 53 seconds before the OS actually starts loading. This means there is about a 2.5 minute wait from power at the wall enabled to a finished POST screen. Stripping the BIOS by disabling the extra controllers gives a sizeable boost, reducing the POST time by 35 seconds.


64 Comments
View All Comments
JonnyDough - Tuesday, January 8, 2013 - link
I don't know if I speak for everyone, but I would really love to see some gaming benchmarks.I realize that this system is not designed or optimized for gaming, but it would be interesting nonetheless to see what two processors does, or does not do for gaming. :)
npcomplete - Tuesday, January 8, 2013 - link
...it just gets to the meat of computing!Thanks for this article. It woke up the scientist in me.
esung - Wednesday, January 9, 2013 - link
I'm very curious as the result. Have you tried to bench 1 2690 vs 2 2690s? It almost like the benchmark are limited by CPU frequency instead of threads/cores it has.CodeToad - Saturday, January 19, 2013 - link
Ian - I really enjoyed reading your effort here. There is a large, and I think underserved, community of scientific users who need this kind of information. Digging through IEEE/ASM communications is often just too much. Doing the work here - or anywhere - is a real help.I'm a retired economist (PhD Chicago, '81) and (in my case) thankfully haven't done physical, much less computational, chemistry since undergrad. Never the less, we have similar technical needs.
I've become a huge fan of open source software. In my "home lab," which my wife calls The Frat House, some grad students and I have been diligently working with the R Language (statistics), nascent risk and optimization tools, and a mash-up of database, data warehouse, and "business intelligence" tools, all open source. The goal someday -- beat SAS silly and obviate that $100-300K price tag!
The more demure and do-able daily work is just cleaning up and optimizing open source code, contributing that back as individual packages. The "hits" and email indicates a good adoption rate.
Ian, CUDA is of big interest to the people we're in communication with, and I have to admit some real fascination personally. As you have real-world experience, how about a series of articles. I hope ANDATECH would support that work!!
Very best to you - hope to be "reading" you soon!!