MyDigitalSSD SMART & BP3 mSATA SSD Review
by Kristian Vättö on January 22, 2013 1:24 PM ESTAnandTech Storage Bench 2011
Last year we introduced our AnandTech Storage Bench, a suite of benchmarks that took traces of real OS/application usage and played them back in a repeatable manner. Anand assembled the traces out of frustration with the majority of what we have today in terms of SSD benchmarks.
Although the AnandTech Storage Bench tests did a good job of characterizing SSD performance, they weren't stressful enough. All of the tests performed less than 10GB of reads/writes and typically involved only 4GB of writes specifically. That's not even enough exceed the spare area on most SSDs. Most canned SSD benchmarks don't even come close to writing a single gigabyte of data, but that doesn't mean that simply writing 4GB is acceptable.
Originally we kept the benchmarks short enough that they wouldn't be a burden to run (~30 minutes) but long enough that they were representative of what a power user might do with their system. Later, however, we created what we refer to as the Mother of All SSD Benchmarks (MOASB). Rather than only writing 4GB of data to the drive, this benchmark writes 106.32GB. This represents the load you'd put on a drive after nearly two weeks of constant usage. And it takes a long time to run.
1) The MOASB, officially called AnandTech Storage Bench 2011—Heavy Workload, mainly focuses on the times when your I/O activity is the highest. There is a lot of downloading and application installing that happens during the course of this test. Our thinking was that it's during application installs, file copies, downloading, and multitasking with all of this that you can really notice performance differences between drives.
2) We tried to cover as many bases as possible with the software incorporated into this test. There's a lot of photo editing in Photoshop, HTML editing in Dreamweaver, web browsing, game playing/level loading (Starcraft II and WoW are both a part of the test), as well as general use stuff (application installing, virus scanning). We included a large amount of email downloading, document creation, and editing as well. To top it all off we even use Visual Studio 2008 to build Chromium during the test.
The test has 2,168,893 read operations and 1,783,447 write operations. The IO breakdown is as follows:
| AnandTech Storage Bench 2011—Heavy Workload IO Breakdown | ||||
| IO Size | % of Total | |||
| 4KB | 28% | |||
| 16KB | 10% | |||
| 32KB | 10% | |||
| 64KB | 4% | |||
Only 42% of all operations are sequential; the rest ranges from pseudo to fully random (with most falling in the pseudo-random category). Average queue depth is 4.625 IOs, with 59% of operations taking place in an IO queue of 1.
Many of you have asked for a better way to really characterize performance. Simply looking at IOPS doesn't really say much. As a result we're going to be presenting Storage Bench 2011 data in a slightly different way. We'll have performance represented as Average MB/s, with higher numbers being better. At the same time we'll be reporting how long the SSD was busy while running this test. These disk busy graphs will show you exactly how much time was shaved off by using a faster drive vs. a slower one during the course of this test. Finally, we will also break out performance into reads, writes, and combined. The reason we do this is to help balance out the fact that this test is unusually write intensive, which can often hide the benefits of a drive with good read performance.
There's also a new light workload for 2011. This is a far more reasonable, typical every day use case benchmark. It has lots of web browsing, photo editing (but with a greater focus on photo consumption), video playback, as well as some application installs and gaming. This test isn't nearly as write intensive as the MOASB but it's still multiple times more write intensive than what we were running last year.
We don't believe that these two benchmarks alone are enough to characterize the performance of a drive, but hopefully along with the rest of our tests they will help provide a better idea. The testbed for Storage Bench 2011 has changed as well. We're now using a Sandy Bridge platform with full 6Gbps support for these tests.
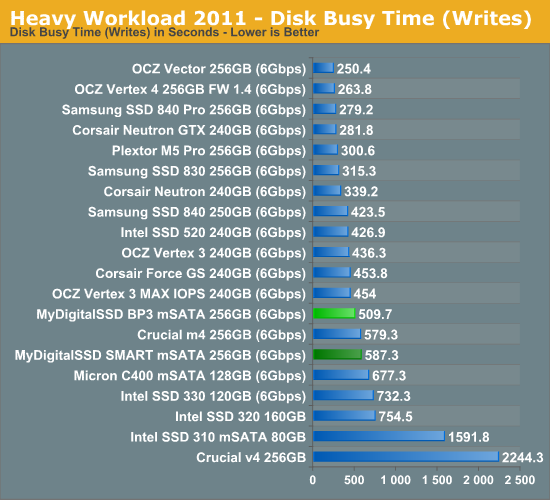
AnandTech Storage Bench 2011—Heavy Workload
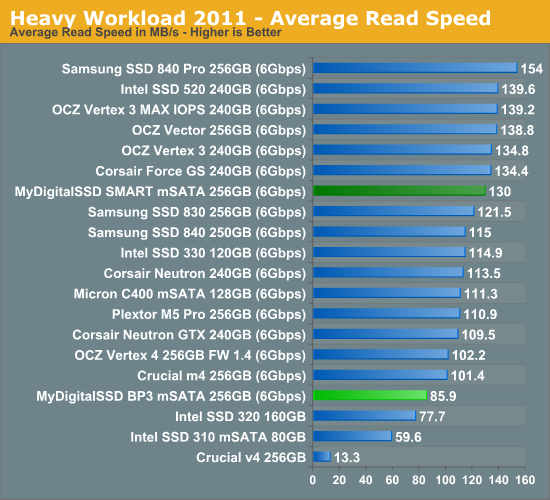
We'll start out by looking at average data rate throughout our new heavy workload test:
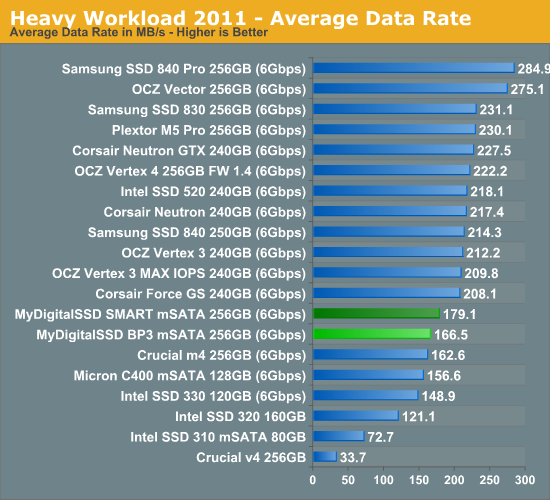
Despite the limitations of the PS3108 controller, the BP3 performs decently. The gap between it and the SandForce based SMART is only 12.6MB/s in our Heavy suite. Neither of the drives is able to keep up with standard 2.5" SSDs, but it's worthwhile to note that some of this is due to the limited NAND bandwidth (4 packages versus 8-16 in 2.5" SSDs).

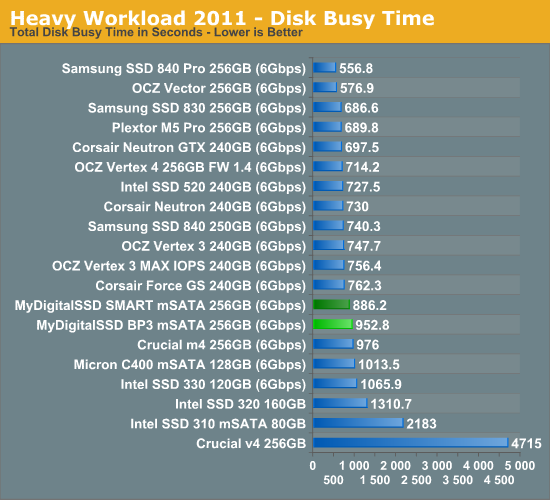
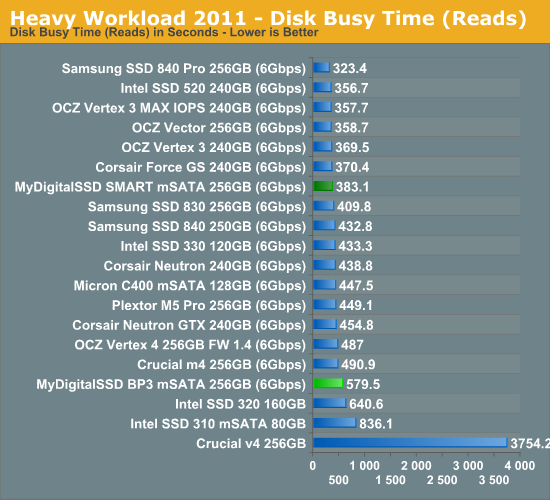
The next three charts just represent the same data, but in a different manner. Instead of looking at average data rate, we're looking at how long the disk was busy for during this entire test. Note that disk busy time excludes any and all idles, this is just how long the SSD was busy doing something:


49 Comments
View All Comments
philipma1957 - Tuesday, January 22, 2013 - link
The crucial mSata 256gb is pretty good for asrock z77-itx board and for intels h77 itx board.They allow for a small desktop. I would like the 3 mobos I used to allow sata III they only allow Sata II.
philipma1957 - Tuesday, January 22, 2013 - link
Follow upI have these mobos
ASRock Z77E-ITX LGA 1155 Intel Z77 HDMI SATA 6Gb/s USB 3.0 Mini ITX Intel Motherboard
Intel BOXDH77DF LGA 1155 Intel H77 HDMI SATA 6Gb/s USB 3.0 Mini ITX Intel Motherboard
ASUS Maximus V Gene LGA 1155 Intel Z77 HDMI SATA 6Gb/s USB 3.0 Micro ATX Intel Motherboard
all are running with just the crucial msata 256gb ssds .
I would not mind one with a Sata III slot , I do agree msata is not offered as viable option for the system builder.
Death666Angel - Tuesday, January 22, 2013 - link
All I could find is that mSATA is only specified for SATA 1.5Gb/s and SATA 3 Gb/s, not SATA 6 Gb/s.nathanddrews - Tuesday, January 22, 2013 - link
Forgive me if I missed it, but should there be a benchmark showing performance consistency when factoring 25% spare area? Given AT's recent affinity for such benchmarks, I now expect to see it in every SSD review./rabble rabble!
Kristian Vättö - Tuesday, January 22, 2013 - link
It's not something we test with every drive because for example all SandForce drives behave the same way. I've actually had these drives for nearly six months and tested them long ago but the write up was pushed back by more urgent reviews. I know I may sound lazy here, but I don't consider the BP3 or SMART to be the choice for many already given the fact that mSATA isn't very popular and I see the majority of buyers going with name brands, so I decided not to test performance consistency this time.The random write speed is rather slow to begin with, and it gets below 1MB/s when tortured.
fugu_ - Tuesday, January 22, 2013 - link
It would have been nice to see performance consistency benchmarks for the drive that used the Phison controller, especially since there are only a handful of options for ~250GB mSATA drives.It's great to see any sort of reviews of lesser known drives. At the same time, it's a little disappointing that the perceived popularity of these drives stopped you from doing a more complete review, especially if you've had them for 6 months.
Kristian Vättö - Tuesday, January 22, 2013 - link
Yeah, I know it's not a proper excuse. This spring will be quite busy for me though, have plenty of SSDs to review and at the same time I should study for matriculation exams as well as university entrance exams.I know I shouldn't be making excuses, but I hope you can relate to my situation. I try to cut as few corners as possible but performance consistency is just PITA to test (well, the actual testing is fine but making the graphs is just painful because Microsoft can't make Office that's fully compatible with Office for Mac... Anand does the graphs on Mac, so I have to do too or they won't be identical). After that it's time for awful HTML editing which I suck at, so that takes way more time than it should.
Per Hansson - Wednesday, January 23, 2013 - link
Well if this is the place where we ask you to do performance consistency tests before your exams I'm in :)I would just love to see how the most crappy SSD controller of all; the JMicron JMF602 fares in performance consistency.
I think it would be a nice thing to look back at with what we know today.
Shockingly SSD's based on such controllers are still being sold!
http://www.prisjakt.nu/kategori.php?k=893#rparams=...
lyeoh - Wednesday, January 23, 2013 - link
Yeah I'd like to see the performance consistency for the lower end or even crap SSDs.Maybe even a few conventional spinning platter hard drives- low, mid, high.
Kristian Vättö - Wednesday, January 23, 2013 - link
Unfortunately, I don't have any SSDs that old. The "worst" SSDs I have are Crucial v4, OCZ Agility 4 and Samsung SSD 470. I could definitely run something on the V4 and BP3 to see if Phison has done any progress in this matter.