Samsung SSD 840 Pro (256GB) Review
by Anand Lal Shimpi on September 24, 2012 7:00 AM EST- Posted in
- Storage
- SSDs
- Samsung
- Samsung SSD 840
Random Read/Write Speed
The four corners of SSD performance are as follows: random read, random write, sequential read and sequential write speed. Random accesses are generally small in size, while sequential accesses tend to be larger and thus we have the four Iometer tests we use in all of our reviews.
Our first test writes 4KB in a completely random pattern over an 8GB space of the drive to simulate the sort of random access that you'd see on an OS drive (even this is more stressful than a normal desktop user would see). I perform three concurrent IOs and run the test for 3 minutes. The results reported are in average MB/s over the entire time. We use both standard pseudo randomly generated data for each write as well as fully random data to show you both the maximum and minimum performance offered by SandForce based drives in these tests. The average performance of SF drives will likely be somewhere in between the two values for each drive you see in the graphs. For an understanding of why this matters, read our original SandForce article.
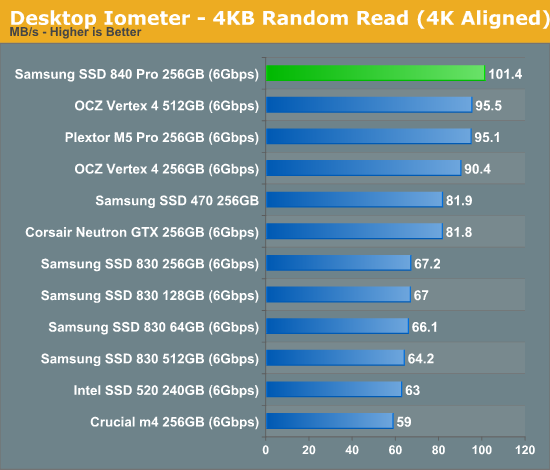
We have a new king, the 840 Pro manages to inch past the fastest Vertex 4 in our random read performance test.
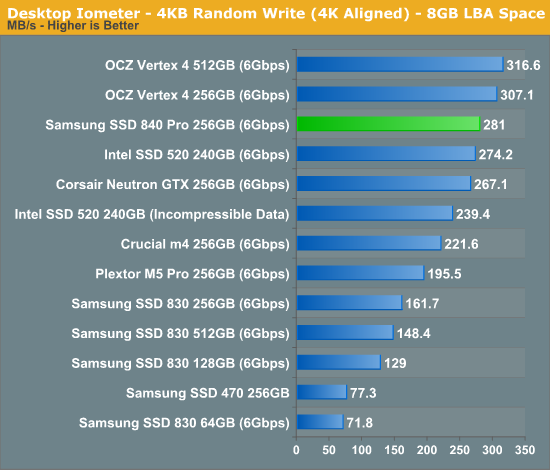
The low queue depth random write performance crown goes back to the Vertex 4, but the 840 Pro is around 75% faster than the old 830. Other than the Vertex 4, there's nothing faster than the 840 Pro here.
Many of you have asked for random write performance at higher queue depths. What I have below is our 4KB random write test performed at a queue depth of 32 instead of 3. While the vast majority of desktop usage models experience queue depths of 0 - 5, higher depths are possible in heavy I/O (and multi-user) workloads:
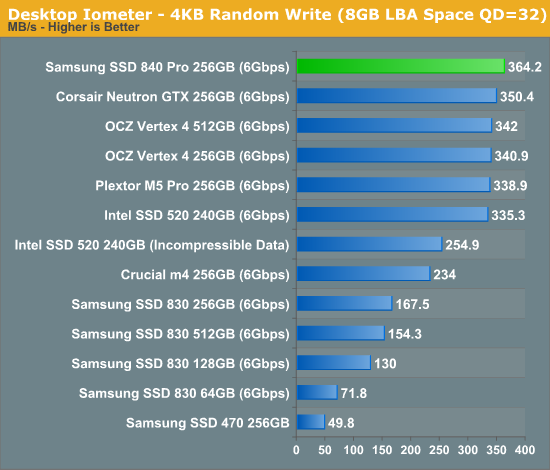
Ramp up queue depth and the 840 Pro manages to even outperform Corsair's new Neutron GTX.
Sequential Read/Write Speed
To measure sequential performance I ran a 1 minute long 128KB sequential test over the entire span of the drive at a queue depth of 1. The results reported are in average MB/s over the entire test length.
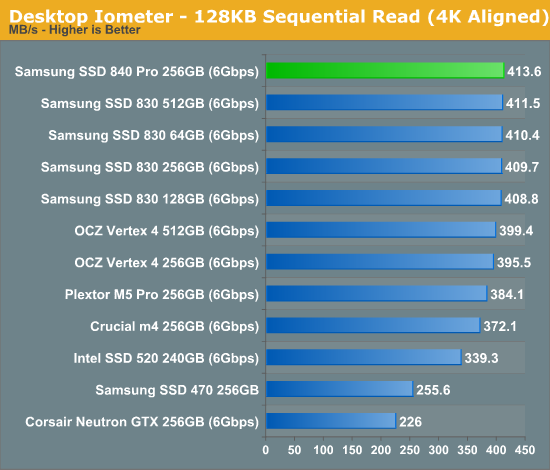
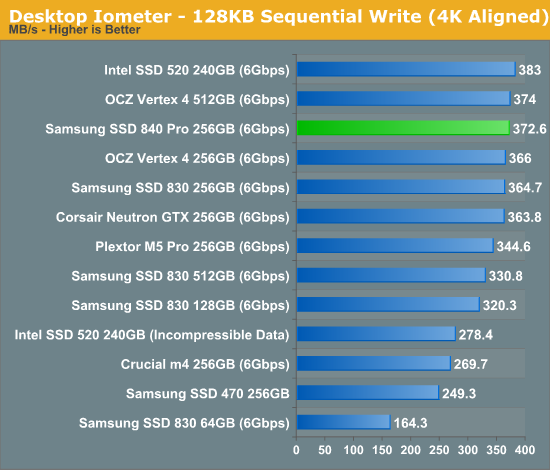
There are no tradeoffs here: excellent random IO performance and class leading low queue depth sequential performance. The 840 Pro is looking like a good all-around performer.
AS-SSD Incompressible Sequential Performance
The AS-SSD sequential benchmark uses incompressible data for all of its transfers. The result is a pretty big reduction in sequential write speed on SandForce based controllers.
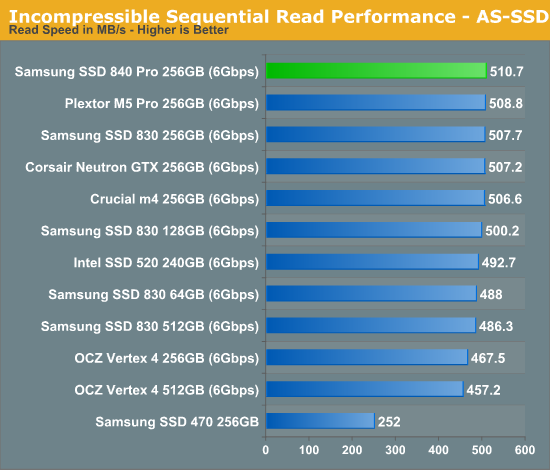
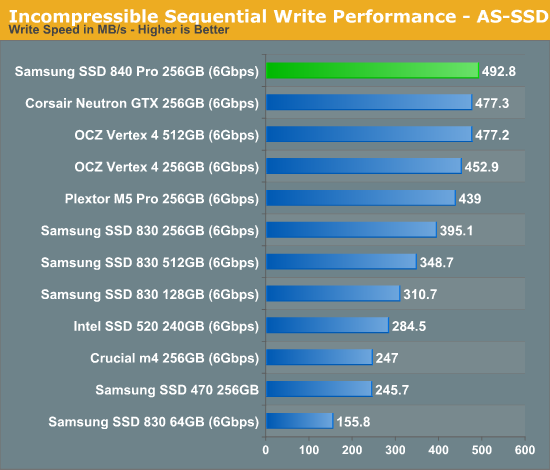
The 840 Pro lands on top once again in these higher queue depth sequential tests. The competition is hot on the heels of the 840 Pro however, we're limited by 6Gbps SATA here so expect continued clustering around 500MB/s going forward.


96 Comments
View All Comments
B3an - Tuesday, September 25, 2012 - link
When will you guys have the 840 Pro added to Bench?Kristian Vättö - Thursday, September 27, 2012 - link
Here you go: http://www.anandtech.com/bench/Product/665hrrmph - Tuesday, September 25, 2012 - link
On the recent SSD reviews, thanks for taking the time to let us know about the tool box utilities!!
After years of using OCZ, I just deployed my first Intel 520 a month ago. It's a solid 'no hiccup' performer so far.
Now that the 840 Pro makes Samsung competitive with the best SSDs on performance, warranty, and utilities, I look forward to trying it out.
I particularly like the idea of being able to use the Samsung Magician software to set the spare area. All of my machines have other drives for bulk data, so being able to allocate some unused space on the SSD for use as spare area seems logical.
-
zer0sum - Tuesday, September 25, 2012 - link
Why are some SSD tests on AT being run with Z68, 2500k @ 3.3ghz with turbo and EIST enabled, 1600Mhz ram, and then this one with H67, 2600k @ 3.4 with turbo and EIST disabled, and 1333Mhz ram?Does this effect performance in any of the tests?
Per Hansson - Tuesday, September 25, 2012 - link
It very well might, EIST has been known to cause problems for SSD's in the past.Also would be very interesting to hear Anands thoughts on the power consumption concerns raised above (DIPM: Device Initiated Power Management)
Per Hansson - Tuesday, September 25, 2012 - link
A quick Google shows the first link to Anandtech's own forums, and a quite good confirmation that EIST affects performance by a quite noticeable margin!http://www.google.co.uk/search?hl=en&q=eist+ss...
zer0sum - Tuesday, September 25, 2012 - link
Ok, I had lower than expected 4k write scores with my 3570k @4.5ghz, using EIST and turbo mode so I went with some advice and ran a single thread of prime95 whilst doing an AS-SSD run.Big difference!!
http://www.overclock.net/t/1242088/official-vertex...
mr. president - Tuesday, September 25, 2012 - link
Nice review. I'd still want to see more 'exotic' use cases tested and especially ones that test garbage collection where TRIM isn't available.ZiL ZFS and software RAID spring to mind. Or, from a more consumer oriented standpoint, the PS3 can benefit from an SSD but it has no TRIM support.
serpretetsky - Wednesday, September 26, 2012 - link
"Assuming the premature death of our review sample was a fluke and not indicative of a bigger issue,"Care to elaborate on this? It simply failed after you guys ran all the tests on it?
Is there any way you guys might get another sample and run it through the same (or harder) tests?
Thanks for the review, you guys are awesome.
capeconsultant - Wednesday, September 26, 2012 - link
I second this request :)