The NVIDIA GeForce GTX 660 Review: GK106 Fills Out The Kepler Family
by Ryan Smith on September 13, 2012 9:00 AM ESTCompute Performance
As always our final set of real-world benchmarks is composed of a look at compute performance. As we have seen with GTX 680 and GTX 670, Kepler appears to be significantly less balanced between rendering and compute performance than GF110 or GF114 were, and as a result compute performance suffers. Further compounding this is the fact that GK106 only has 5 SMXes versus the 8 SMXes of GK104, which will likely further depress compute performance.
Our first compute benchmark comes from Civilization V, which uses DirectCompute to decompress textures on the fly. Civ V includes a sub-benchmark that exclusively tests the speed of their texture decompression algorithm by repeatedly decompressing the textures required for one of the game’s leader scenes. Note that this is a DX11 DirectCompute benchmark.
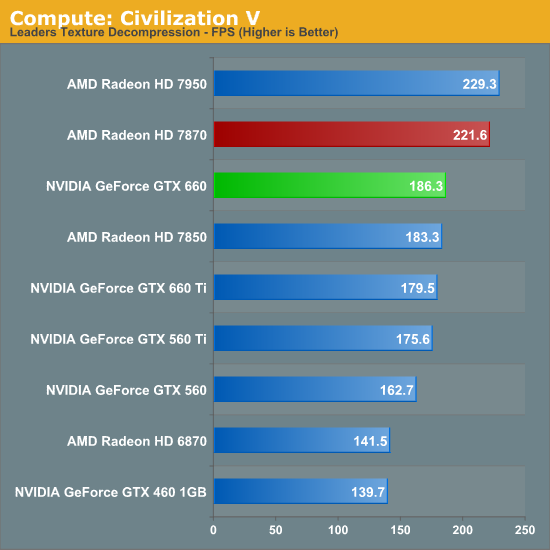
It’s interesting then that despite the obvious difference between the GTX 660 and GTX 660 Ti in theoretical compute performance, the GTX 660 actually beats the GTX 660 Ti here. Despite being a compute benchmark, Civlization V’s texture decompression benchmark is more sensitive to memory bandwidth and cache performance than it is shader performance, giving us the results we see above. Given the GTX 660 Ti’s poor showing in this benchmark this is a good thing for NVIDIA since this means they don’t fall any farther behind. Still, the GTX 660 is effectively tied with the 7850 and well behind the 7870.
Our next benchmark is SmallLuxGPU, the GPU ray tracing branch of the open source LuxRender renderer. We’re now using a development build from the version 2.0 branch, and we’ve moved on to a more complex scene that hopefully will provide a greater challenge to our GPUs.
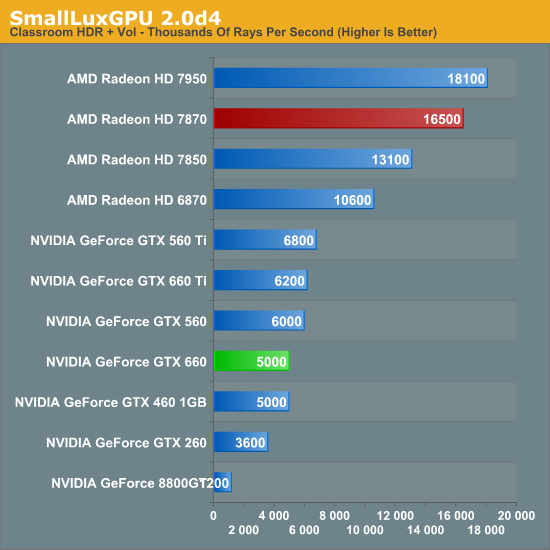
SmallLuxGPU sees us shift towards an emphasis on pure compute performance, which of course is going to be GTX 660’s weak point here. Over 2 years after the launch of the GTX 460 and SLG performance has gone exactly nowhere, with the GTX 460 and GTX 660 turning in the same exact scores. Thank goodness the 8800GT is terrible at this benchmark, otherwise the GTX 660 would be in particularly bad shape.
It goes without saying that with the GTX 660’s poor compute performance here, the 7800 series is well in the lead. The 7870 more than trebles the GTX 660’s performance, an indisputable victory if there ever was one.
For our next benchmark we’re looking at AESEncryptDecrypt, an OpenCL AES encryption routine that AES encrypts/decrypts an 8K x 8K pixel square image file. The results of this benchmark are the average time to encrypt the image over a number of iterations of the AES cypher.
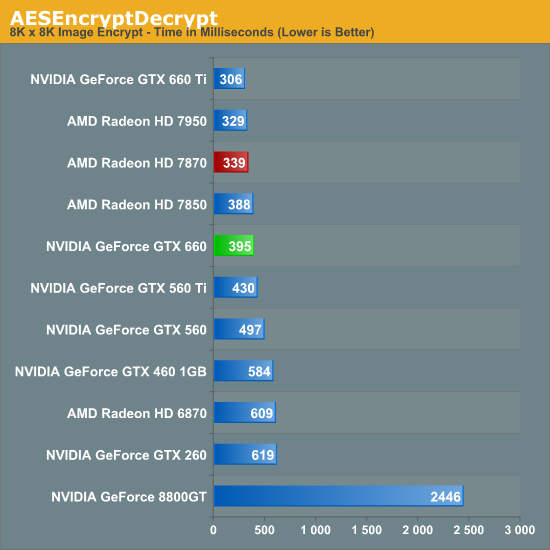
Our AES benchmark was one of the few compute benchmarks where the GTX 660 Ti had any kind of lead, but the significant loss of compute resources has erased that for the GTX 660. At 395ms it’s a hair slower than the 7850, never mind the 7870.
For our next benchmark we’re looking at AESEncryptDecrypt, an OpenCL AES encryption routine that AES encrypts/decrypts an 8K x 8K pixel square image file. The results of this benchmark are the average time to encrypt the image over a number of iterations of the AES cypher.
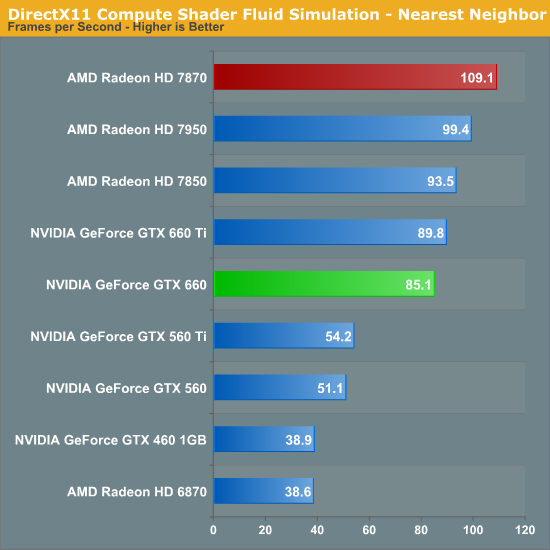
The fluid simulation is another benchmark that includes a stronger mix of memory bandwidth and cache rather than being purely dependent on compute resources. As a result the GTX 660 still trails the GTX 660 Ti, but by a great amount. Even so, the GTX 660 is no match for the 7800 series.
Finally, we’re adding one last benchmark to our compute run. NVIDIA and the Folding@Home group have sent over a benchmarkable version of the client with preliminary optimizations for Kepler. Folding@Home and similar initiatives are still one of the most popular consumer compute workloads, so it’s something NVIDIA wants their GPUs to do well at.
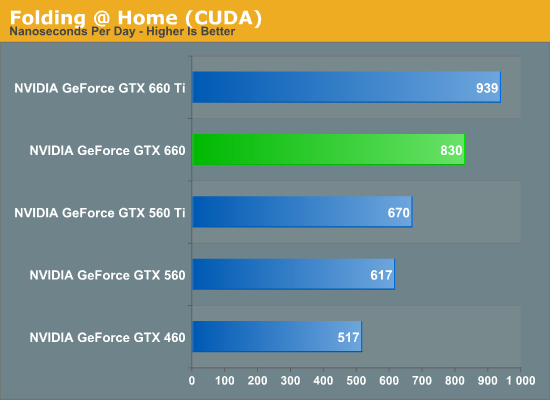
As we’ve seen previously with GK104, this is one of the few compute benchmarks that shows any kind of significant performance advantage for Little Kepler compared to Little Fermi. GTX 660 drops by 12% compared to GTX 660 Ti, but this is still good enough for a 60% performance advantage over GTX 460.


147 Comments
View All Comments
Margalus - Thursday, September 13, 2012 - link
you say the stock 660 looks bad when compared to an overclocked 7870? what a shock that is!I guess it's always fair to say an nvidia card is bad when comparing the stock reference nv card to overclocked versions of it's nearest amd competitor..
Patflute - Friday, September 14, 2012 - link
Be fair and over clock both...poohbear - Thursday, September 13, 2012 - link
well after reading this im still have with my Gigabyte OC gtx 670 i got 2 months ago for $388. I will NOT be upgrading for 3 years & im confident my GTX 670 will still be in the upper segment in 3 years (like my 5870 that i upgraded from), so @ $130/yr its a great deal.poohbear - Thursday, September 13, 2012 - link
erm, i meant i'm still happy*. sucks that u can't edit on these comments.:pKineticHummus - Friday, September 14, 2012 - link
i had no idea what you meant with your "im still happy" edit until I went back to read your original statement again. somehow I mentally replaced the "have" with "happy" lol. reading fail for me...distinctively - Thursday, September 13, 2012 - link
Looks like the 660 is getting a nasty little spanking from the 7870 when you look around at all the reviews. The GK 106 appears to loose in just about every metric compared to Pitcairn.Locateneil - Thursday, September 13, 2012 - link
I just built a PC with 3770K and Asus Z77-v Pro, I was think to buy GTX 670 for my system but now I am now confused if it is better to go with 2 GTX 660 in SLI?Ryan Smith - Friday, September 14, 2012 - link
Our advice has always been to prefer a single more powerful card over a pair of weaker cards in SLI. SLI is a great mechanism to extend performance beyond what a single card can provide, but its inconsistent performance and inherent drawbacks (need for SLI profiles and microstuttering) means that it's not a good solution for when you can have a single, more powerful GPU.knghtwhosaysni - Thursday, September 13, 2012 - link
Do you guys think you could show frametimes like techreport does in your reviews? It can show some deficiencies in rendering that average FPS doesn't, like with Crysis 2 http://techreport.com/review/23527/nvidia-geforce-...It's nice that techreport does it, but I think Anandtech is the first stop for a lot of people who are looking for benchmarks, and I think if you guys showed this data in your own reviews then it would really push AMD and Nvidia to iron out their latency spike problems.
Ryan Smith - Friday, September 14, 2012 - link
We get asked this a lot. I really like Scott's methodology there, so if we were to do this I'd want to do more than just copy him by finding some way to do better than him (which is no easy task).To that end I find FRAPS to be at a higher level than I'd like. It's measuring when frames are handed off to the GPU rather than when the GPU actually finishes the frame. These times are strongly correlated, but I'd rather have more definitive low-level data from the GPU itself. If we could pull that off then frametimes are definitely something we'd look in to.