Kingston HyperX 3K (240GB) SSD Review
by Anand Lal Shimpi on April 10, 2012 3:00 AM ESTAnandTech Storage Bench 2011
Two years ago we introduced our AnandTech Storage Bench, a suite of benchmarks that took traces of real OS/application usage and played them back in a repeatable manner. I assembled the traces myself out of frustration with the majority of what we have today in terms of SSD benchmarks.
Although the AnandTech Storage Bench tests did a good job of characterizing SSD performance, they weren't stressful enough. All of the tests performed less than 10GB of reads/writes and typically involved only 4GB of writes specifically. That's not even enough exceed the spare area on most SSDs. Most canned SSD benchmarks don't even come close to writing a single gigabyte of data, but that doesn't mean that simply writing 4GB is acceptable.
Originally I kept the benchmarks short enough that they wouldn't be a burden to run (~30 minutes) but long enough that they were representative of what a power user might do with their system.
Not too long ago I tweeted that I had created what I referred to as the Mother of All SSD Benchmarks (MOASB). Rather than only writing 4GB of data to the drive, this benchmark writes 106.32GB. It's the load you'd put on a drive after nearly two weeks of constant usage. And it takes a *long* time to run.
1) The MOASB, officially called AnandTech Storage Bench 2011 - Heavy Workload, mainly focuses on the times when your I/O activity is the highest. There is a lot of downloading and application installing that happens during the course of this test. My thinking was that it's during application installs, file copies, downloading and multitasking with all of this that you can really notice performance differences between drives.
2) I tried to cover as many bases as possible with the software I incorporated into this test. There's a lot of photo editing in Photoshop, HTML editing in Dreamweaver, web browsing, game playing/level loading (Starcraft II & WoW are both a part of the test) as well as general use stuff (application installing, virus scanning). I included a large amount of email downloading, document creation and editing as well. To top it all off I even use Visual Studio 2008 to build Chromium during the test.
The test has 2,168,893 read operations and 1,783,447 write operations. The IO breakdown is as follows:
| AnandTech Storage Bench 2011 - Heavy Workload IO Breakdown | ||||
| IO Size | % of Total | |||
| 4KB | 28% | |||
| 16KB | 10% | |||
| 32KB | 10% | |||
| 64KB | 4% | |||
Only 42% of all operations are sequential, the rest range from pseudo to fully random (with most falling in the pseudo-random category). Average queue depth is 4.625 IOs, with 59% of operations taking place in an IO queue of 1.
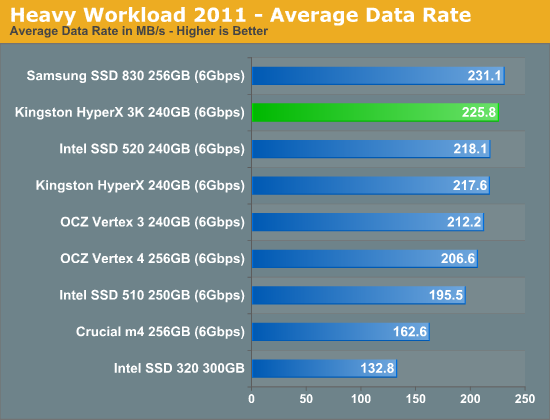
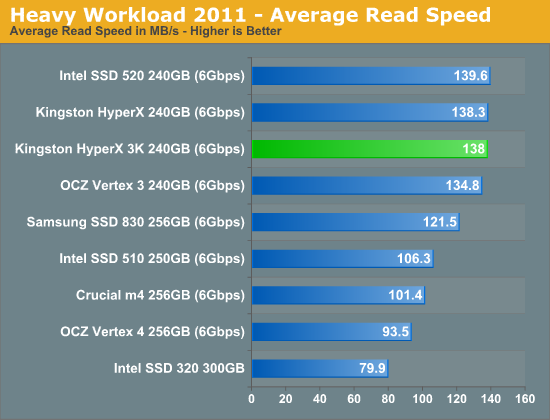
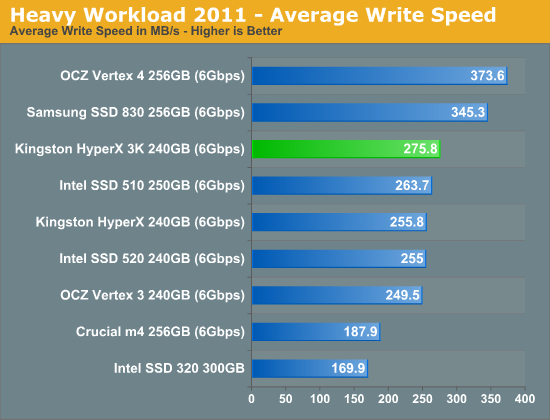
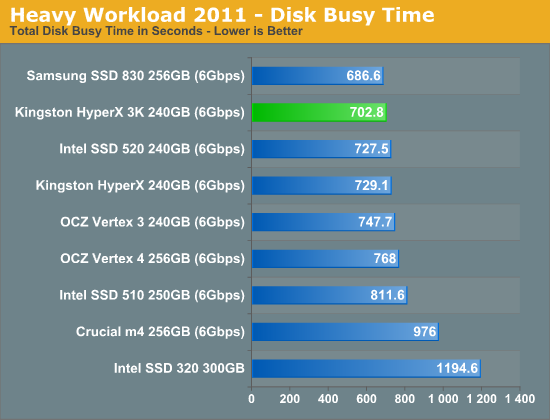
Many of you have asked for a better way to really characterize performance. Simply looking at IOPS doesn't really say much. As a result I'm going to be presenting Storage Bench 2011 data in a slightly different way. We'll have performance represented as Average MB/s, with higher numbers being better. At the same time I'll be reporting how long the SSD was busy while running this test. These disk busy graphs will show you exactly how much time was shaved off by using a faster drive vs. a slower one during the course of this test. Finally, I will also break out performance into reads, writes and combined. The reason I do this is to help balance out the fact that this test is unusually write intensive, which can often hide the benefits of a drive with good read performance.
There's also a new light workload for 2011. This is a far more reasonable, typical every day use case benchmark. Lots of web browsing, photo editing (but with a greater focus on photo consumption), video playback as well as some application installs and gaming. This test isn't nearly as write intensive as the MOASB but it's still multiple times more write intensive than what we were running in 2010.
As always I don't believe that these two benchmarks alone are enough to characterize the performance of a drive, but hopefully along with the rest of our tests they will help provide a better idea.
The testbed for Storage Bench 2011 has changed as well. We're now using a Sandy Bridge platform with full 6Gbps support for these tests.
AnandTech Storage Bench 2011 - Heavy Workload
We'll start out by looking at average data rate throughout our heavy workload test:
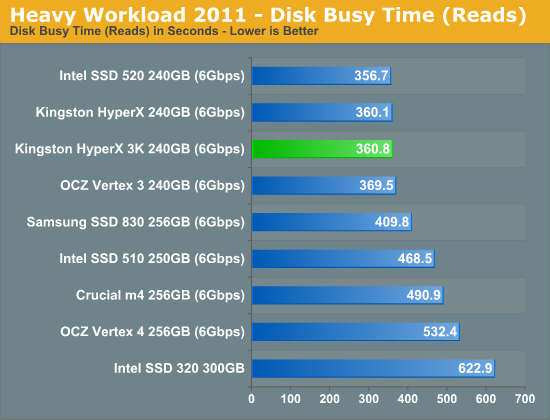
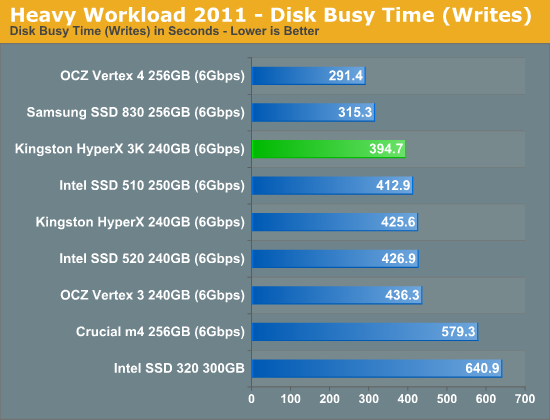
The next three charts just represent the same data, but in a different manner. Instead of looking at average data rate, we're looking at how long the disk was busy for during this entire test. Note that disk busy time excludes any and all idles, this is just how long the SSD was busy doing something:


44 Comments
View All Comments
NetCommercial - Thursday, November 22, 2012 - link
Long time reader just signed up to comment as it appears you actually read them and do take into consideration the comment itself.First off thank you for the benchmarks and simplifying the results the best you can. I enjoyed the article showing the Kingston X that is on sale at Newegg for BFriday and was considering it.
After reading I will pass. I am a video editor. I think a good percentage of us are in some way using our computers for more then gaming. After all the rigs people are putting together are ridiculous for gaming. I play games online and get kicked all the time for being too 'fast'. That is with a dinosaur of a pre-made Dell bucket.
With that being stated I would like to see an area where you guys do shoot outs with the same sized/priced equipment doing renders with decent sized files. For instance the review did on the King x was terrific however where was Plextor @ ? It is in the price range and does compete with the Sammy 830/ 840pro IMO... This article just started to brief on that scenario.
Again Thank you for your help, advice and time you put into these articles. You are one of my resource hubs of trusted information.
Best,
NetCommercial
ickibar1234 - Monday, December 2, 2013 - link
The Desktop IOMeter 4K random read of only 40MB/s is kind of sad. I'm sure that is with a queue depth of 1 but still.Dahaka - Monday, December 14, 2015 - link
Hi!.Almost 4 years since this review and is an awesome article, that's why i come here to post some doubts about this SSD.
Anyone can tell me (approximately) how good or bad will perform this SSD into a workload enviroment?, like using an ERP (like Microsoft Dynamics plus Roadnet)?.
The OS and programs will be virtualized.
If anyone needs more specifications about the server i can give more details.
Regards.
remax - Sunday, June 19, 2016 - link
Hyper X is the way to go! But why listen to me - look at my SSD data - speaks for itself:KINGSTON SH103S3240G
240GB
SMART READ DATA
Revision: 10
Attributes List
1: (SSD Raw Read Error Rate) Normalized Rate: 120 Sectors Read: 0 Read Errors: 0
5: (SSD Retired Block Count) Spare blocks remaining 100% Retired Block 0
9: (SSD Power-On Hours) Value 84 Total 14084 hrs 47 mins
12: (SSD Power Cycle Count) Power Cycle Life Remaining 99% Number of power cycles 1334
171: (SSD Program Fail Count) Program Error Count 0
172: (SSD Erase Fail Count) Erase Error Count 0
174: (SSD Unexpected power loss count) Unexpected power loss Count 259
177: (Wear Range Delta) Wear Range Delta 2%
181: (Program Fail Count) Program Error Count 0
182: (Erase Fail Count) Erase Error Count 0
187: (SSD Reported Uncorrectable Errors) Normalized Value 100 lifetime URAISE Errors 0
194: (SSD Temperature Monitoring) Normalized temp 36 Current 36 High 81 Low 236
195: (SSD ECC On-the-fly Count) Normalized Value 120 Sectors Read 0 UECC Count 0
196: (SSD Reallocation Event Count) Normalized Value 100 Reallocation Event Count 0
201: (SSD Uncorrectable Soft Read Error Rate)Normalized Value 120 Sectors Read 0 Uncorrectable Soft Error Count 0
204: (SSD Soft ECC Correction Rate (RAISE) Normalized Value 120 Sectors Read 0 Soft ECC Correction Count 0
230: (SSD Life Curve Status) Normalized Value 100
231: (SSD Life Left) Life Remaining 100%
233: (SSD Internal Reserved) 13615
234: (SSD Internal Reserved) 15250
241: (SSD Lifetime writes from host) lifetime writes 15250 GB
242: (SSD Lifetime reads from host) lifetime reads 9061 GB
Any questions?