Intel Z68 Chipset & Smart Response Technology (SSD Caching) Review
by Anand Lal Shimpi on May 11, 2011 2:34 AM ESTAnandTech Storage Bench 2011
With the hand timed real world tests out of the way, I wanted to do a better job of summarizing the performance benefit of Intel's SRT using our Storage Bench 2011 suite. Remember that the first time anything is ever encountered it won't be cached and even then, not all operations afterwards will be cached. Data can also be evicted out of the cache depending on other demands. As a result, overall performance looks more like a doubling of standalone HDD performance rather than the multi-x increase we see from moving entirely to an SSD.
Heavy 2011—Background
Last year we introduced our AnandTech Storage Bench, a suite of benchmarks that took traces of real OS/application usage and played them back in a repeatable manner. I assembled the traces myself out of frustration with the majority of what we have today in terms of SSD benchmarks.
Although the AnandTech Storage Bench tests did a good job of characterizing SSD performance, they weren't stressful enough. All of the tests performed less than 10GB of reads/writes and typically involved only 4GB of writes specifically. That's not even enough exceed the spare area on most SSDs. Most canned SSD benchmarks don't even come close to writing a single gigabyte of data, but that doesn't mean that simply writing 4GB is acceptable.
Originally I kept the benchmarks short enough that they wouldn't be a burden to run (~30 minutes) but long enough that they were representative of what a power user might do with their system.
Not too long ago I tweeted that I had created what I referred to as the Mother of All SSD Benchmarks (MOASB). Rather than only writing 4GB of data to the drive, this benchmark writes 106.32GB. It's the load you'd put on a drive after nearly two weeks of constant usage. And it takes a *long* time to run.
First, some details:
1) The MOASB, officially called AnandTech Storage Bench 2011—Heavy Workload, mainly focuses on the times when your I/O activity is the highest. There is a lot of downloading and application installing that happens during the course of this test. My thinking was that it's during application installs, file copies, downloading and multitasking with all of this that you can really notice performance differences between drives.
2) I tried to cover as many bases as possible with the software I incorporated into this test. There's a lot of photo editing in Photoshop, HTML editing in Dreamweaver, web browsing, game playing/level loading (Starcraft II & WoW are both a part of the test) as well as general use stuff (application installing, virus scanning). I included a large amount of email downloading, document creation and editing as well. To top it all off I even use Visual Studio 2008 to build Chromium during the test.
The test has 2,168,893 read operations and 1,783,447 write operations. The IO breakdown is as follows:
| AnandTech Storage Bench 2011—Heavy Workload IO Breakdown | ||||
| IO Size | % of Total | |||
| 4KB | 28% | |||
| 16KB | 10% | |||
| 32KB | 10% | |||
| 64KB | 4% | |||
Only 42% of all operations are sequential, the rest range from pseudo to fully random (with most falling in the pseudo-random category). Average queue depth is 4.625 IOs, with 59% of operations taking place in an IO queue of 1.
Many of you have asked for a better way to really characterize performance. Simply looking at IOPS doesn't really say much. As a result I'm going to be presenting Storage Bench 2011 data in a slightly different way. We'll have performance represented as Average MB/s, with higher numbers being better. At the same time I'll be reporting how long the SSD was busy while running this test. These disk busy graphs will show you exactly how much time was shaved off by using a faster drive vs. a slower one during the course of this test. Finally, I will also break out performance into reads, writes and combined. The reason I do this is to help balance out the fact that this test is unusually write intensive, which can often hide the benefits of a drive with good read performance.
There's also a new light workload for 2011. This is a far more reasonable, typical every day use case benchmark. Lots of web browsing, photo editing (but with a greater focus on photo consumption), video playback as well as some application installs and gaming. This test isn't nearly as write intensive as the MOASB but it's still multiple times more write intensive than what we were running last year.
As always I don't believe that these two benchmarks alone are enough to characterize the performance of a drive, but hopefully along with the rest of our tests they will help provide a better idea.
The testbed for Storage Bench 2011 has changed as well. We're now using a Sandy Bridge platform with full 6Gbps support for these tests. All of the older tests are still run on our X58 platform.
AnandTech Storage Bench 2011—Heavy Workload
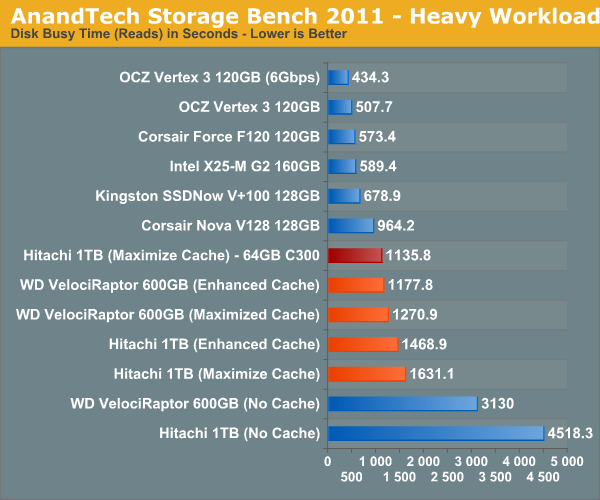
We'll start out by looking at average data rate throughout our new heavy workload test:
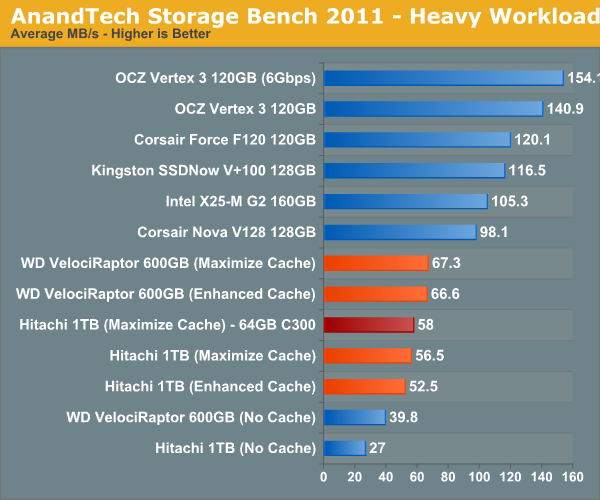
For this comparison I used two hard drives: 1) a Hitachi 7200RPM 1TB drive from 2008 and 2) a 600GB Western Digital VelociRaptor. The Hitachi 1TB is a good large, but aging drive, while the 600GB VR is a great example of a very high end spinning disk. With a modest 20GB cache enabled, the 3+ year old Hitachi drive is easily 41% faster than the VelociRaptor. We're still not into dedicated SSD territory, but the improvement is significant.
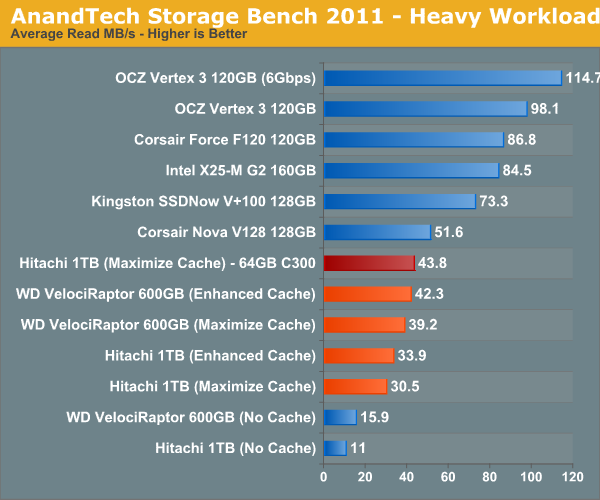
I also tried swapping the cache drive out with a Crucial RealSSD C300 (64GB). Performance went up a bit but not much. You'll notice that average read speed got the biggest boost from the C300 as a cache drive since it does have better sequential read performance. Overall I am impressed with Intel's SSD 311, I just wish the drive were a little bigger.
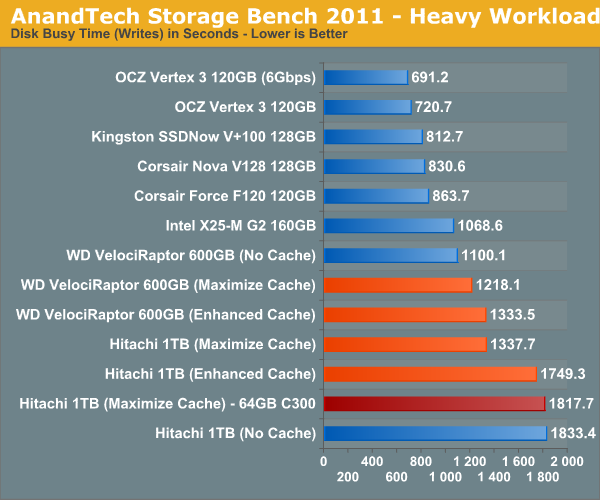
The breakdown of reads vs. writes tells us more of what's going on:
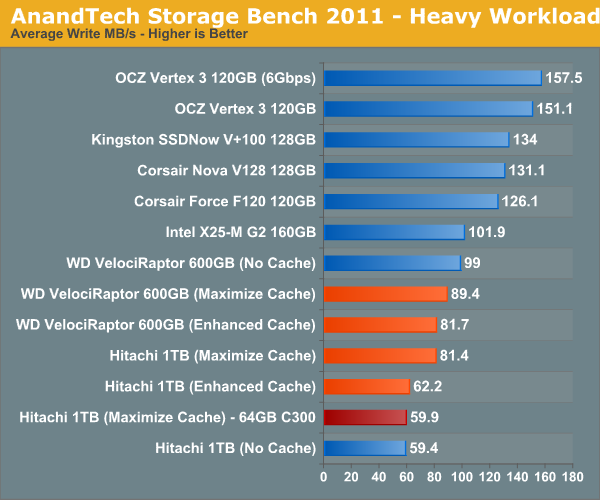
This isn't too unusual—pure write performance is actually better with the cache disabled than with it enabled. The SSD 311 has a good write speed for its capacity/channel configuration, but so does the VelociRaptor. Overall performance is still better with the cache enabled, but it's worth keeping in mind if you are using a particularly sluggish SSD with a hard drive that has very good sequential write performance.
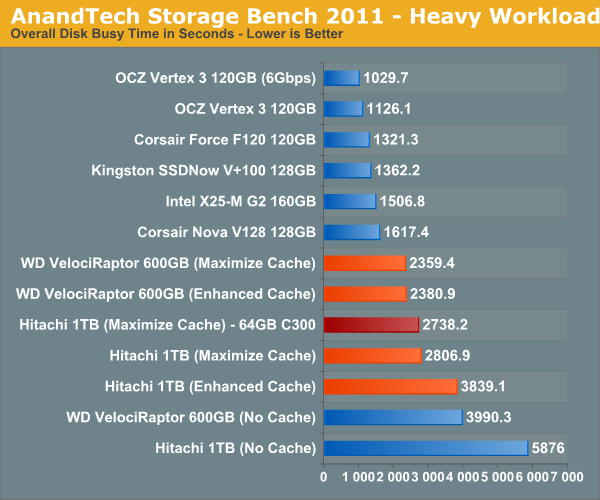
The next three charts just represent the same data, but in a different manner. Instead of looking at average data rate, we're looking at how long the disk was busy for during this entire test. Note that disk busy time excludes any and all idles, this is just how long the SSD was busy doing something:


106 Comments
View All Comments
dagamer34 - Wednesday, May 11, 2011 - link
Like most technologies, stay away from first-gen implementations.iwod - Wednesday, May 11, 2011 - link
I wonder if you could install 32GB DDR3 RAM, and just use 20GB of that as Intel SRT.It would be interesting to see how its performance went.
kmmatney - Wednesday, May 11, 2011 - link
Wouldn't be persistent between restarts, so that's a problem right there. It would have to build up the cache every time you reboot, and you couldn't use "Max Cache" mode, so you'd have to wait for the HDD for all writes.liveonc - Wednesday, May 11, 2011 - link
In this article, it was pointed out that using an SSD is still better for those who want speed. But is a SATA3 SSD & SATA2 Velociraptor combo possible? Or what about an SSD + SSD/HDD combo? Some sort of comprimise w/o the great penalties, or smaller penalties & greater value?dgingeri - Wednesday, May 11, 2011 - link
I've seen similar numbers using a smaller SSD with Windows 7's ReadyBoost, and it kept the most used data in the cache better. I'd prefer just using that, as it seems more predictable.jordanclock - Wednesday, May 11, 2011 - link
This IS a big deal. However, a comparison of performance between SRT and ReadyBoost would be handy. Especially ReadyBoost with USB3.dgingeri - Wednesday, May 11, 2011 - link
you can (and I have) set up ReadyBoost to a SATA SSD. I had a 60GB OCZ Apex as my ReadyBoost drive for about 6 months, before I got my dual Vertex 2s as a new boot drive. Windows 7 has a limit of 32GB for Readyboost usage, though. It made a heck of a difference in boot time and some program load time, however, it took a little while to get the caching set up right to cache what I actually used on a regular basis. It started caching Firefox rather quickly, but took it a while to pick up on caching Diablo 2.randinspace - Wednesday, May 11, 2011 - link
I still haven't been able to finish the multiplayer mode due to hardware issues stranding me on a glorified netbook.DesktopMan - Wednesday, May 11, 2011 - link
Anand: http://soerennielsen.dk/mod/VGAdummy/index_en.phpShouldn't this work perfectly fine to enable the IGPU when connected to the DGPU without any of the driver nonsense?
Hrel - Wednesday, May 11, 2011 - link
I'd REALLY like to see you guys compare this SRT caching to two of the fastest 7200rpm drives out there in RAID 0. Cause 1-4 seconds on launching applications on loading game levels isn't work 100 extra bucks.So compare configurations: 1 MD
1 MD with Cache
2MD in RAID 0 (MD = Mechanical Disk)
2 MD in RAID 0 with cache
Vertex 3 SSD by itself (and/or the really fast Corsair one)
You already have most of this testing done and in this article.
PLEASE PLEASE PLEASE PLEASE do this soon! Thanks guys!