The SSD Diaries: Crucial's RealSSD C300
by Anand Lal Shimpi on July 13, 2010 12:39 AM ESTRandom Read/Write Speed
The four corners of SSD performance are as follows: random read, random write, sequential read and sequential write speed. Random accesses are generally small in size, while sequential accesses tend to be larger and thus we have the four Iometer tests we use in all of our reviews.
Our first test reads/writes 4KB in a completely random pattern over an 8GB space of the drive to simulate the sort of random access that you'd see on an OS drive (even this is more stressful than a normal desktop user would see). I perform three concurrent IOs and run the test for 3 minutes. The results reported are in average MB/s over the entire time.
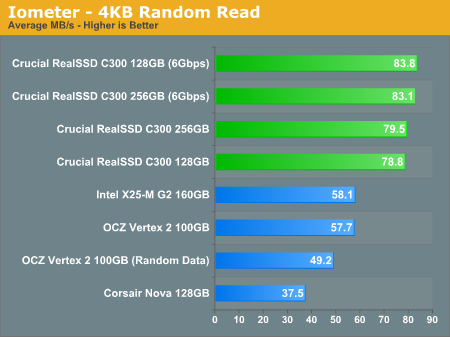
The C300 offers by far the best random read performance of any SSD we’ve tested. This applies to both the 256GB and 128GB versions of the C300, and while operating on a 3Gbps SATA controller. There’s a roughly 38% performance advantage over the SandForce based OCZ Vertex 2 and Intel X25-M G2. There's hardly any benefit to moving to a 6Gbps controller here as the transfer rates don't even saturate 1.5Gbps SATA.
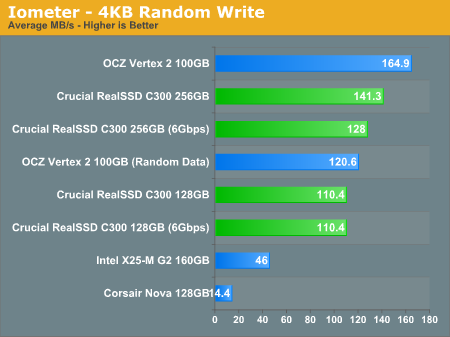
Random write speed is similarly high, but not quite as dominant. Intel’s X25-M G2 simply shows its age here. You must keep in mind that the G2 was a mild update to the original X25-M, an architecture that was designed back in 2006 - 2007 and first sold in 2008. The X25-M G2 is simply an old architecture by today’s standards. While it makes a great value SSD, there should be no surprise that a C300 is over twice as fast in our 4KB random write test.
It’s the SandForce comparison that’s less cut and dry. By default Iometer uses data that is highly repetitive in nature. While our random test writes data to random addresses, the contents of the data itself isn’t random. The Vertex 2’s SF-1200 controller recognizes the obvious pattern in the data and just doesn’t write most of it to the drive. This is the best case scenario for the SandForce controller architecture. Now it’s absolutely a realistic workload, but not always likely.
Using a custom build of Iometer we are able to write completely random data to the drive. This data can’t be compressed and effectively defeats SandForce’s write amplification reduction algorithm. I’d argue that this scenario is even less likely than one where the data is nearly infinitely compressible, at least for a desktop user. SandForce claims that an install of Windows 7 + Office 2007 requires less than half the writes on one of its drives compared to a traditional SSD.
The point here is that while I can present performance in both cases, the real world write performance of the Vertex 2 and other SandForce drives will be somewhere in between the two numbers you see represented in the chart above. And compared to the 128GB C300, I’d say it’s likely that the Vertex 2 has the advantage in 4K random write performance. The 256GB drive improves performance enough where I’d be comfortable saying it’s probably a tossup between the two.
The 6Gbps performance is an odd story to tell here. The 128GB drive actually performs the same regardless of whether or not it's on our 6Gbps controller, however the 256GB drive takes a performance hit going to the 6Gbps controller (HighPoint Rocket 620, using the Marvell 88SE9128 controller similar to many motherboards). This is purely a fault of the controller and unfortunately one of the tradeoffs you'll have to make with the move to 6Gbps. It's very difficult to beat Intel's own SATA controller.
Many of you have asked for random write performance at higher queue depths. What I have below is our 4KB random write test performed at a queue depth of 32 instead of 3. While the vast majority of desktop usage models experience queue depths of 0 - 5, higher depths are possible in heavy I/O workloads:
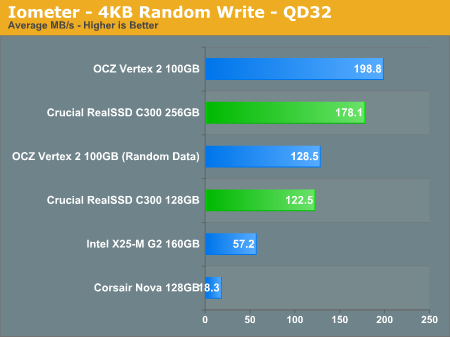
While the 128GB C300 is slower than the 100GB Vertex 2, the 256GB version hangs with the SandForce posterchild. If you need the capacity, the 256GB C300 is easily a good performer even at high queue depths.


51 Comments
View All Comments
fgmg2 - Tuesday, July 13, 2010 - link
I know that I could flip back and forth between the various charts to calculate the performance per a watt, but it be great to get a consolidated chart that graphed the drives based upon write (read?) performance per a watt.Additionally analyzing drives purely based upon their write/read performance and/or purely based upon their power consumption seems a bit meaningless. It should be very easy to make a drive consumes almost no power but writes slower than a 3 1/2" floppy. Especially as you see some drives perform more than twice as fast as others.
Just a suggestion.
P.S. It might not be a bad idea to do the same for your other reviews, such as video cards and CPUs.
7Enigma - Tuesday, July 13, 2010 - link
Agreed. In most reviews (video cards for example) performance per watt is somewhat less important as normally you'll be modeling or gaming and the power draw is going to be pretty stable.But for a hard drive, especially when many of these will be notebook replacements, it is very important. I have an Intel G2 80GB and love it, and when I look at the power consumption numbers it looks better than the C300. But I'm not naive to the fact that (when TRIM'd) the C300 crushes the G2 in pretty much every benchmark. What that tells me is that in a real-world result the C300 would use more power but get the job done in a shorter time and since we aren't spinning up a traditional platter, the HD behaves very much like a modern Intel CPU and would go idle.
That hurry up and get idle I think would skew those power consumption charts heavily.
What I would design would be a benchmark that has a set instruction set (write 2GB of random, 2 GB of sequential, read 10GB of data), and then measure the TOTAL power of the drive consumed during that time. Then report that total power number and use it for future reviews (a static number to rank similar to a PCMark or Vantage score)
Ernestds - Tuesday, July 13, 2010 - link
I think the best way to calculate efficiency is measuring the total energy used by the drive doing the "Typical Workload" test. Of course, if Anand could do the same with the "Heavy Downloading Workload" it would be great. IMO there is no need for the "Gaming Workload" though, usually who looks for the power graphs is aiming the improvness(does this word exist?) of a notebook's battery life, and frequently who cares about that, do not game on battery.Just a question to Anand, do you feel difference between two SSDs, say the Nova one and the Crucial?
Keep on the great work!
MrSpadge - Tuesday, July 13, 2010 - link
It's kind of funny to see someone asking for power efficiency for something which is probably the most power efficient thing in the entire PC, especially if you compare it to HDDs. I understand it's interesting and maybe even important for laptops, though.I'd rather be interested in more detailed power draw and/or efficiency analysis in case where the power draw really hurts: GPUs and to a lesser extent CPU. For example: how does the power draw of a GF100 improve under load if you watercool it? Sure, not very relevant for most users.. but the difference should be surprisingly large.
shin0bi272 - Tuesday, July 13, 2010 - link
If you want best overall performance go sandforce. The only real large advantage the crucial drive had was in read performance. sysmark et al were within a few hundred points of one another. So the overall feel of the system will be identical till you either do some heavy read ops or conversely you fill the drive and dont trim it. With the prices being about the same for the 100 vs 128 the better performer is the sandforce drives.Techdad - Tuesday, July 13, 2010 - link
Really? You'd take the performance tricks and the risk of real data that doesn't fit SandFarce's fancy algorithms over the straight honest performance of the Crucial drive? That's odd.I've had my Crucial drive since it came out and it's been great. In spite of Anand's corner-case bashing the first version firmware has been rock solid. Debating even if I want to bother with the firmware upgrade, but I'll probably do it.
bji - Tuesday, July 13, 2010 - link
Relying on TRIM and optimizing for the least stressful case is also a "performance trick", so your implication that Sandforce uses such tricks and Micron does not is wrong. Also your childish pun on the Sandforce name shows alot about where you are coming from.The Sandforce and the Micron drives look to have very similar performance in the vast majority of cases, so shin0bi272 is spot-on. And the increased cost of the Crucial drive would seem to be the deciding factor for me.
But you can't go wrong with either offering it would seem, so pick whichever you like best. As for myself, I would pick Sandforce, only because of my extreme aversion to any chance of degraded drive performance, having been bitten by stuttering of early drives. Not saying that the Crucial drive is anything like a JMicron, but I personally value the resiliency of the Sandforce controller very highly, and would pay some peak performance cost happily for the guarantee of better worst-case performance.
Not everyone will, or should, have the same opinion on this; those less averse to the risks of worst-case performance degredation would be well served by the Crucial drive.
hotlips69 - Tuesday, July 13, 2010 - link
Having read this review, I'm considering buying one of the 100GB "OCZ Vertex 2" drives used in this article, but I'm not sure exactly which is the correct drive model as there seem to be numerous "Vertex 2" drives on the OCZ website!!Is it the Pro Series or EX Series or just the standard Vertex 2 series???
hotlips69 - Tuesday, July 13, 2010 - link
....also, why is it listed as 120GB in the chart on page 1 of the article?Anand Lal Shimpi - Tuesday, July 13, 2010 - link
A standard Vertex 2 120GB drive is all you need. The 100GB capacities will probably be phased out by most SandForce partners over time as there's no tangible performance benefit for desktop workloads.I just used the 100GB data we had in the engine which is why it appears as such in the charts.
Take care,
Anand