OCZ's Agility 2 Reviewed: The First SF-1200 with MP Firmware
by Anand Lal Shimpi on April 21, 2010 7:22 PM ESTAnandTech Storage Bench
Note that our 6Gbps controller driver isn't supported by our custom storage bench here, so the C300 results are only offered in 3Gbps mode.
The first in our benchmark suite is a light usage case. The Windows 7 system is loaded with Firefox, Office 2007 and Adobe Reader among other applications. With Firefox we browse web pages like Facebook, AnandTech, Digg and other sites. Outlook is also running and we use it to check emails, create and send a message with a PDF attachment. Adobe Reader is used to view some PDFs. Excel 2007 is used to create a spreadsheet, graphs and save the document. The same goes for Word 2007. We open and step through a presentation in PowerPoint 2007 received as an email attachment before saving it to the desktop. Finally we watch a bit of a Firefly episode in Windows Media Player 11.
There’s some level of multitasking going on here but it’s not unreasonable by any means. Generally the application tasks proceed linearly, with the exception of things like web browsing which may happen in between one of the other tasks.
The recording is played back on all of our drives here today. Remember that we’re isolating disk performance, all we’re doing is playing back every single disk access that happened in that ~5 minute period of usage. The light workload is composed of 37,501 reads and 20,268 writes. Over 30% of the IOs are 4KB, 11% are 16KB, 22% are 32KB and approximately 13% are 64KB in size. Less than 30% of the operations are absolutely sequential in nature. Average queue depth is 6.09 IOs.
The performance results are reported in average I/O Operations per Second (IOPS):
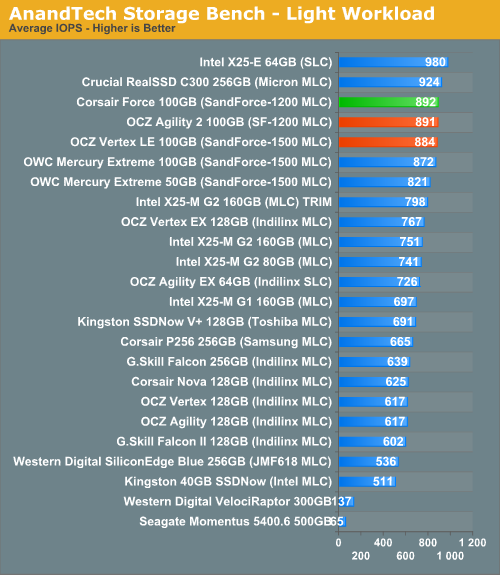
It's not terribly surprising that we're not seeing any performance difference between the Agility 2 and other SandForce drives here. The only difference is in sustained random write performance and desktop workloads simply don't sustain purely random writes for that long a period.
If there’s a light usage case there’s bound to be a heavy one. In this test we have Microsoft Security Essentials running in the background with real time virus scanning enabled. We also perform a quick scan in the middle of the test. Firefox, Outlook, Excel, Word and Powerpoint are all used the same as they were in the light test. We add Photoshop CS4 to the mix, opening a bunch of 12MP images, editing them, then saving them as highly compressed JPGs for web publishing. Windows 7’s picture viewer is used to view a bunch of pictures on the hard drive. We use 7-zip to create and extract .7z archives. Downloading is also prominently featured in our heavy test; we download large files from the Internet during portions of the benchmark, as well as use uTorrent to grab a couple of torrents. Some of the applications in use are installed during the benchmark, Windows updates are also installed. Towards the end of the test we launch World of Warcraft, play for a few minutes, then delete the folder. This test also takes into account all of the disk accesses that happen while the OS is booting.
The benchmark is 22 minutes long and it consists of 128,895 read operations and 72,411 write operations. Roughly 44% of all IOs were sequential. Approximately 30% of all accesses were 4KB in size, 12% were 16KB in size, 14% were 32KB and 20% were 64KB. Average queue depth was 3.59.
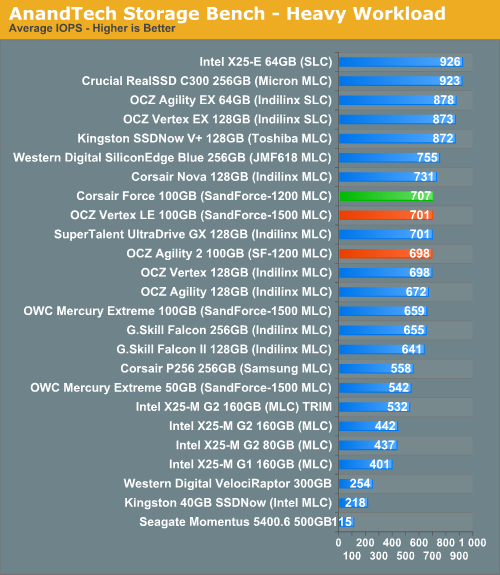
Our heavy multitasking test definitely racks up the sequential writes, again we don't see any difference between the Agility 2 and other SandForce drives.
The gaming workload is made up of 75,206 read operations and only 4,592 write operations. Only 20% of the accesses are 4KB in size, nearly 40% are 64KB and 20% are 32KB. A whopping 69% of the IOs are sequential, meaning this is predominantly a sequential read benchmark. The average queue depth is 7.76 IOs.
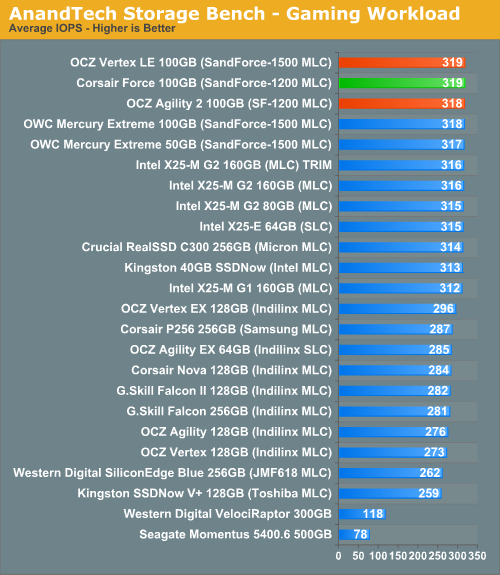
Here we're completely bound by read performance.


60 Comments
View All Comments
beginner99 - Friday, April 23, 2010 - link
One thought:Wouldn't it be possible just tp use the vertex 2 "special" firmware for tis drive? I mean as far as i understood the controllers are 100% identical it is the firmware that makes the difference. Same should be true for any SF-1200 drive.
But i'm not gonna try it out myself. ;)
Moonstarr - Sunday, May 9, 2010 - link
Exactly what I was thinking. Take a look at the photos in the gallery and you'll see that the board revisions and controller are identical. Only the branding of the ram looks different.jordanl17 - Saturday, April 24, 2010 - link
Does anyone use these SSDs in a server? Image a 7 drive raid-5 array ?!?!? it would be great. (I'm talking about for a Terminal Server 2008 64bit. all new hardware)I'd like to buy either an HP or IBM blade setup and use 2 of these drives in raid-1 in each blade.
Does anyone know if this is possible? I know it wouldn't be as reliable as regular hard drive, but I'd keep a few on hand as backup.
charlielittle - Saturday, April 24, 2010 - link
I'm using a 128gb NOVA in a Dell D820 with WinXP. I'd like to keep its great performance up to snuff without doing a full wipe. I was wondering, would it be possible to plug it in as an extra drive on my Win7 desktop and run some utility to force TRIM commands for any/all unused blocks on the drive? Does it have to be the boot drive for TRIM to be enabled by Win7?Thanks,
--C
iwodo - Sunday, April 25, 2010 - link
While Sandforce was slower in Seq Read / Write with Random Data. Would the setting have any different on other non Sandforce SSD.pesos - Sunday, April 25, 2010 - link
it would be awesome if a SAS 15k drive could be thrown into these SSD benchmarks going forward for those of us interested in doing enterprise comparisons!remmelt - Monday, April 26, 2010 - link
The SSDnow V+ second generation doesn't perform all that well in the individual tests, but scores remarkably well in the overall performance graphs. Considering price per GB, this might be a great alternative.Can anyone explain the difference in the low scores on individual tasks and high scores in the overal benchmarks for this drive?
Squuiid - Monday, April 26, 2010 - link
Anand, excellent review as always, thanks very much.Any updates on your Crucial drive? Are you now confident recommending the drive? Has the new one they sent you been reliable and has the performance degradation now been fixed?
Sorry for the million questions.
brain42 - Wednesday, April 28, 2010 - link
I notice that the latest drives have much higher random write performance than the random read performance, even though the typical scenario has more reads than writes.Could this be a symptom that the SSD industry is becoming so focused on random write, that the random read performance is forgotten? When all the reviewers focus solely on the random write performance, you can't really blame the industry for sacrificing performance in other areas.
fishak - Wednesday, April 28, 2010 - link
remmelt, that is my question exactly. Why is the PC Mark score of the Intel G2 controller, so close to Sandforce, while the individual read and write scores of the Intel controller are so far behind?Per GB price of Intel is about $3.50, while Sandforce is about 4 bucks.