OCZ's Agility 2 Reviewed: The First SF-1200 with MP Firmware
by Anand Lal Shimpi on April 21, 2010 7:22 PM ESTAnandTech Storage Bench
Note that our 6Gbps controller driver isn't supported by our custom storage bench here, so the C300 results are only offered in 3Gbps mode.
The first in our benchmark suite is a light usage case. The Windows 7 system is loaded with Firefox, Office 2007 and Adobe Reader among other applications. With Firefox we browse web pages like Facebook, AnandTech, Digg and other sites. Outlook is also running and we use it to check emails, create and send a message with a PDF attachment. Adobe Reader is used to view some PDFs. Excel 2007 is used to create a spreadsheet, graphs and save the document. The same goes for Word 2007. We open and step through a presentation in PowerPoint 2007 received as an email attachment before saving it to the desktop. Finally we watch a bit of a Firefly episode in Windows Media Player 11.
There’s some level of multitasking going on here but it’s not unreasonable by any means. Generally the application tasks proceed linearly, with the exception of things like web browsing which may happen in between one of the other tasks.
The recording is played back on all of our drives here today. Remember that we’re isolating disk performance, all we’re doing is playing back every single disk access that happened in that ~5 minute period of usage. The light workload is composed of 37,501 reads and 20,268 writes. Over 30% of the IOs are 4KB, 11% are 16KB, 22% are 32KB and approximately 13% are 64KB in size. Less than 30% of the operations are absolutely sequential in nature. Average queue depth is 6.09 IOs.
The performance results are reported in average I/O Operations per Second (IOPS):
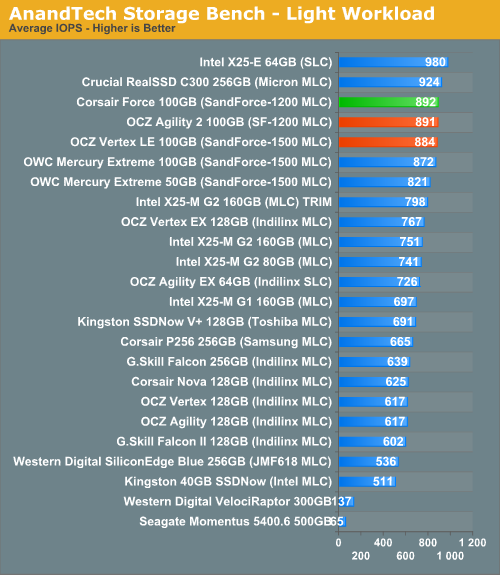
It's not terribly surprising that we're not seeing any performance difference between the Agility 2 and other SandForce drives here. The only difference is in sustained random write performance and desktop workloads simply don't sustain purely random writes for that long a period.
If there’s a light usage case there’s bound to be a heavy one. In this test we have Microsoft Security Essentials running in the background with real time virus scanning enabled. We also perform a quick scan in the middle of the test. Firefox, Outlook, Excel, Word and Powerpoint are all used the same as they were in the light test. We add Photoshop CS4 to the mix, opening a bunch of 12MP images, editing them, then saving them as highly compressed JPGs for web publishing. Windows 7’s picture viewer is used to view a bunch of pictures on the hard drive. We use 7-zip to create and extract .7z archives. Downloading is also prominently featured in our heavy test; we download large files from the Internet during portions of the benchmark, as well as use uTorrent to grab a couple of torrents. Some of the applications in use are installed during the benchmark, Windows updates are also installed. Towards the end of the test we launch World of Warcraft, play for a few minutes, then delete the folder. This test also takes into account all of the disk accesses that happen while the OS is booting.
The benchmark is 22 minutes long and it consists of 128,895 read operations and 72,411 write operations. Roughly 44% of all IOs were sequential. Approximately 30% of all accesses were 4KB in size, 12% were 16KB in size, 14% were 32KB and 20% were 64KB. Average queue depth was 3.59.
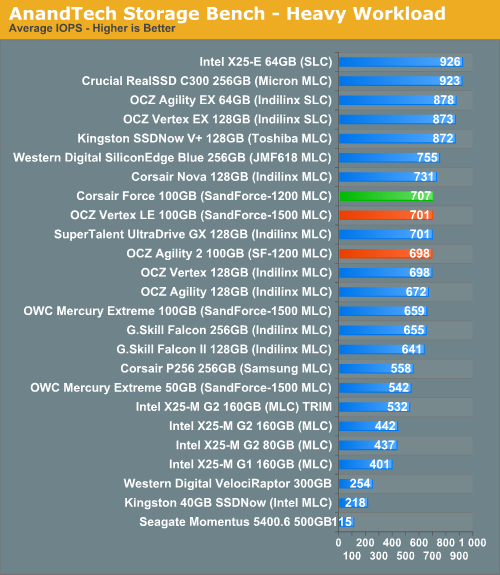
Our heavy multitasking test definitely racks up the sequential writes, again we don't see any difference between the Agility 2 and other SandForce drives.
The gaming workload is made up of 75,206 read operations and only 4,592 write operations. Only 20% of the accesses are 4KB in size, nearly 40% are 64KB and 20% are 32KB. A whopping 69% of the IOs are sequential, meaning this is predominantly a sequential read benchmark. The average queue depth is 7.76 IOs.
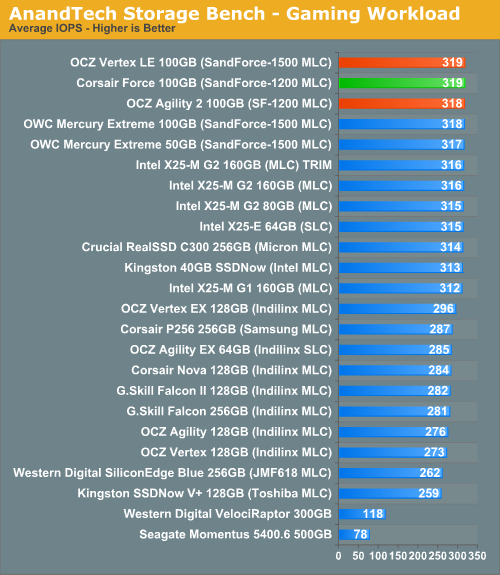
Here we're completely bound by read performance.


60 Comments
View All Comments
berzerk101 - Thursday, April 22, 2010 - link
Hi,
A little question here I was wondering if those SandForce drive have some Garbage recycling in place like the Vertex with there last FW.
If you look on youtube OWC state that there drive don't drop in performance on Mac but there's no TRIM support on Mac last time I checked.
Because for now the only drive I found having some hardware auto-trim working on Mac is the Vertex with Indilinx controller.
Video link:
http://www.youtube.com/watch?v=52OpellvMLQ
Thanks
Hacp - Thursday, April 22, 2010 - link
Anand, you mention Intel/indilinx but not the realssd in your final review? It has the lowest cost per gb AND is one of the best performers. It scored very high on your real world benches.GullLars - Thursday, April 22, 2010 - link
No, not at all. I'm saying if SandForce had made the controller with a SATA 6Gbps interface instead of 3Gbps, it would have maxed the interface anyway for highly compressible data, both reading and writing.With RAW speeds of about 200-220MB/s read and 120-130MB/s write, data compressible to 1:2 could be read at 400-440MB/s and written at 240-260MB/s, and data compressible to 1:3 could be read at 600MB/s and written at 360-390MB/s...
Anand says in his Agility 2 review that sandforce found installing windows 7 and MS office 2007 physically took up less than half of the original size, meaning those kinds of files would be written above 250MB/s and read above 450MB/s...
The sandforce drives get PCmark scores around 38-40K, with a SATA 6Gbps interface i think they would get over 50K, maybe even over 60K. The limiting factor would be the read IOPS, wich tops out around 30-35K IOPS, and wouldn't get a boost by a faster interface since it seems to be controller computing power bound.
Since it seems the 50GB versions are capable of the same both RAW and compressed speeds as 100GB and 200GB versions, a ROC + 2x SF-1200 in a 2,5" enclosure with SATA/SAS 6Gbps interface could be nice. Sort of like OCZ Apex, G.skill Titan, and OCZ Colossus, only made decently with full NCQ support and not tonnes of accesstime overhead. SF-1200 due to price, and (2x10K=) 20K IOPS sustained random write being "enough". Such a drive would give the same numbers as anvil has posted above, at possibly 1,3-1,5x the price, but on a single port, making it easy to scale to insane bandwidth on LSI 92xx for compressible data (over 4GB/s both read and write).
GullLars - Thursday, April 22, 2010 - link
Like the subject says, that was meant as a reply on XS forum...Here is the post i meant to post:
Anand
As always, a great review, but i still miss 4KB random tests at higher queue depths to test out more than just 3 of the flash channels. A graph of 4KB random read with Queue Depth (2^n steps) on the x axis and IOPS/bandwidth on the y axis would also be nice, as it would show scaling by load.
If you were to do this test, you would see that your statement that SandForce's 4KB random read performance on compressed data being worse than Indilinx is false for queue depths over 4, where indilinx tops out at ca 60MB/s = 15K IOPS, while sandforce reaches about 120MB/s. Seing as in that case SandForce has double the 4KB random read performance of Barefoot on uncompressible data, i suggest the statement should be retracted, or at least a note added to state it's not true for higher queue depths.
GullLars - Thursday, April 22, 2010 - link
A little PS to the above:To back my statement with benchmark data:
xtremesystems.org/forums/showpost.php?p=4352703&postcount=56
AS SSD benchmark and CrystalDiskMark 3.0 use hardly compressible data, as shown by the sequential write speeds meassured.
And for those interrested, the benchmark numbers i was reffering to that anvil posted "above" are these:
xtremesystems.org/forums/showpost.php?p=4352876&postcount=57
It's 2 Vertex LE 100GB in RAID-0 off ICH10R, IRST 9.6, WBC off.
vol7ron - Thursday, April 22, 2010 - link
I just want to stress what the graphs show:The Agility's power consumption at idle or full load, is never more than 1W.
That is amazing.
vol7ron
Mr Perfect - Thursday, April 22, 2010 - link
"SandForce also claims that its reduced write amplification could enable the use of cheaper NAND on these drives. It’s an option that some manufacturers may take however OCZ has committed to using the same quality of NAND as it has in the past. The Agility 2 uses 34nm IMFT NAND, presumably similar to what’s used in Intel’s X25-M G2."Sounds good. Hopefully other OEMs follow OCZs example.
Impulses - Thursday, April 22, 2010 - link
Why are you using the street of the Corsair Nova on the Pricing Comparison chart at the end? Isn't that drive essentially the same thing as the OCZ Solid 2? You can get said drive for $70 less after MIR! (and the MIR always seems to be running) That dramatically impacts the cost per GB and it's value when compared to the other drives imo... Even the Agility is still $50 cheaper. The price of the 160GB X25-M seems to be off too, it might've spiked up during the days that the review was posted but it's been pretty easy to find at $450... ($40 less)Realistically the X25-M G2 drives and older Indillix drives end up being much cheaper per GB than the chart would seem to indicate, $2.50-2.75... So you pay quite a substantial premium for a C300 or a SF drive, 'specially if you opt for the 128GB C300 (which costs more per GB than the 256GB version, should include both on the chart for reference imo).
I realize prices are always in shift, but these have actually been pretty stable over the past couple of months and I don't think they're likely to change (outside of specials and/or the occasional rebate) 'till end of year when they all start shifting to 20nm NAND flash... It's kind of amusing that the larger C300 breaks the mold and ends up being one of the better values (if you actually do need that much capacity and have the controller to take advantage of it's full performance); the X25-M and the older Indillix drives are probably still the best option for most people tho.
glugglug - Thursday, April 22, 2010 - link
This is better than we are getting from a Fusion I/O. I know Fusion I/O claims 100K IOPS but I think they need to be 4KB sequential to achieve that.GullLars - Thursday, April 22, 2010 - link
Fusion-IO's IOdrive at 160GB SLC does 100K IOPS 4KB random write.ioXtreme, the 80GB MLC prosumer version on the other hand does around 30K i think.