OCZ's Agility 2 Reviewed: The First SF-1200 with MP Firmware
by Anand Lal Shimpi on April 21, 2010 7:22 PM ESTAnandTech Storage Bench
Note that our 6Gbps controller driver isn't supported by our custom storage bench here, so the C300 results are only offered in 3Gbps mode.
The first in our benchmark suite is a light usage case. The Windows 7 system is loaded with Firefox, Office 2007 and Adobe Reader among other applications. With Firefox we browse web pages like Facebook, AnandTech, Digg and other sites. Outlook is also running and we use it to check emails, create and send a message with a PDF attachment. Adobe Reader is used to view some PDFs. Excel 2007 is used to create a spreadsheet, graphs and save the document. The same goes for Word 2007. We open and step through a presentation in PowerPoint 2007 received as an email attachment before saving it to the desktop. Finally we watch a bit of a Firefly episode in Windows Media Player 11.
There’s some level of multitasking going on here but it’s not unreasonable by any means. Generally the application tasks proceed linearly, with the exception of things like web browsing which may happen in between one of the other tasks.
The recording is played back on all of our drives here today. Remember that we’re isolating disk performance, all we’re doing is playing back every single disk access that happened in that ~5 minute period of usage. The light workload is composed of 37,501 reads and 20,268 writes. Over 30% of the IOs are 4KB, 11% are 16KB, 22% are 32KB and approximately 13% are 64KB in size. Less than 30% of the operations are absolutely sequential in nature. Average queue depth is 6.09 IOs.
The performance results are reported in average I/O Operations per Second (IOPS):
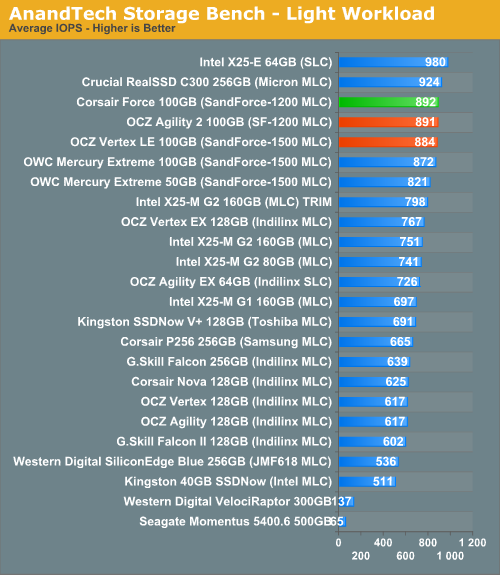
It's not terribly surprising that we're not seeing any performance difference between the Agility 2 and other SandForce drives here. The only difference is in sustained random write performance and desktop workloads simply don't sustain purely random writes for that long a period.
If there’s a light usage case there’s bound to be a heavy one. In this test we have Microsoft Security Essentials running in the background with real time virus scanning enabled. We also perform a quick scan in the middle of the test. Firefox, Outlook, Excel, Word and Powerpoint are all used the same as they were in the light test. We add Photoshop CS4 to the mix, opening a bunch of 12MP images, editing them, then saving them as highly compressed JPGs for web publishing. Windows 7’s picture viewer is used to view a bunch of pictures on the hard drive. We use 7-zip to create and extract .7z archives. Downloading is also prominently featured in our heavy test; we download large files from the Internet during portions of the benchmark, as well as use uTorrent to grab a couple of torrents. Some of the applications in use are installed during the benchmark, Windows updates are also installed. Towards the end of the test we launch World of Warcraft, play for a few minutes, then delete the folder. This test also takes into account all of the disk accesses that happen while the OS is booting.
The benchmark is 22 minutes long and it consists of 128,895 read operations and 72,411 write operations. Roughly 44% of all IOs were sequential. Approximately 30% of all accesses were 4KB in size, 12% were 16KB in size, 14% were 32KB and 20% were 64KB. Average queue depth was 3.59.
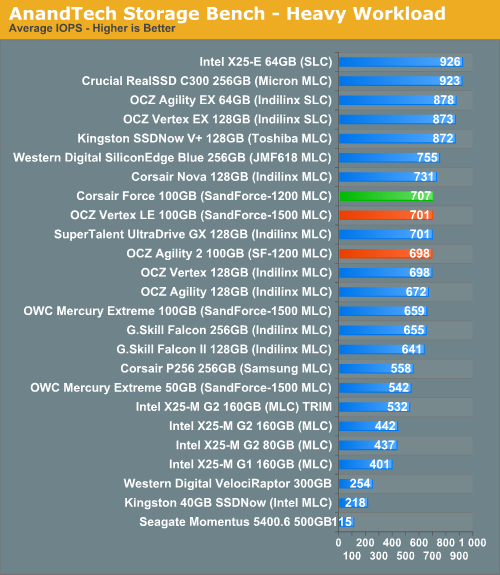
Our heavy multitasking test definitely racks up the sequential writes, again we don't see any difference between the Agility 2 and other SandForce drives.
The gaming workload is made up of 75,206 read operations and only 4,592 write operations. Only 20% of the accesses are 4KB in size, nearly 40% are 64KB and 20% are 32KB. A whopping 69% of the IOs are sequential, meaning this is predominantly a sequential read benchmark. The average queue depth is 7.76 IOs.
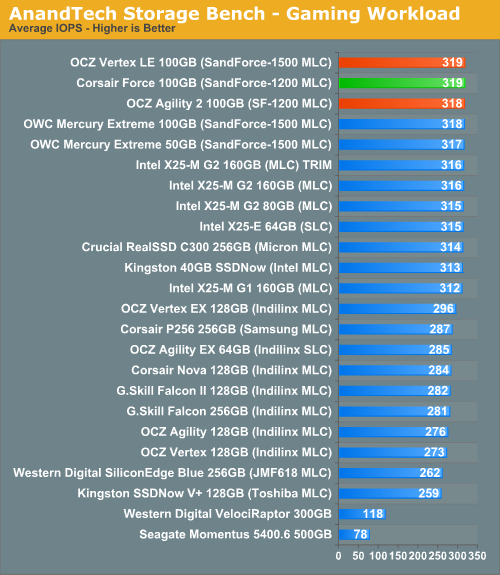
Here we're completely bound by read performance.


60 Comments
View All Comments
speden - Wednesday, April 21, 2010 - link
I still don't understand if the SandForce compression increases the available storage space. Is that discussed in the article somewhere? Is the user storage capacity 93.1 GB if you write uncompressable data, but much larger if you are writing normal data? If so that would effectively lower the cost per gigabyte quite a bit.Ryan Smith - Wednesday, April 21, 2010 - link
It does not increase the storage capacity of the drive. The OS still sees xxGB worth of data as being on the drive even if it's been compressed by the controller, which means something takes up the same amount of reported space regardless of compressibility.The intention of SandForce's compression abilities was not to get more data on to the drive, it was to improve performance by reading/writing less data, and to reduce wear & tear on the NAND as a result of the former.
If you want to squeeze more storage space out of your SSD, you would need to use transparent file system compression. This means the OS compresses things ahead of time and does smaller writes, but the cost is that the SF controller won't be able to compress much if anything, negating the benefits of having the controller do compression if this results in you putting more data on the drive.
arehaas - Thursday, April 22, 2010 - link
The Sandforce drives report the same space available to the user, even if there is less data written to the drive. Does it mean that Sandforce drives should last longer because there are fewer actual writes to the NAND? One would reach the 10 million (or whatever) writes with Sandforce later than with other drives.Ryan Smith - Thursday, April 22, 2010 - link
Exactly.MadMan007 - Wednesday, April 21, 2010 - link
On a note somewhat related to another post here, I have a request. Could you guys please post final 'available to OS' capacity in *gibibytes*? (or if you must post gigabytes to go along with the marketers at the drive companies make it clear you are using GIGA and not GIBI) After I realized how much 'real available to OS' capacity can vary among drives which supposedly have the same capacity this would be very useful information...people need to know how much actual data they can fit on the drives and 'gibibytes available to the OS' is the best standard way to do that.vol7ron - Wednesday, April 21, 2010 - link
Attach all corrections to this post.1st Paragraph: incredible -> incredibly
pattycake0147 - Thursday, April 22, 2010 - link
On the second page, there is no link where the difference between the 1500 and the 1200 are referenced.Roland00 - Thursday, April 22, 2010 - link
The problem with logarithmic scales is your brain interprets the data linerally instead of exponentially unless you force yourself not too.Per Hansson - Thursday, April 22, 2010 - link
I agreeJust as an idea you could have the option to click the graph and get a bigger version, I guess it would be something like 600x3000 in size but would give another angle at the data
Because for 90% of your users I think a logramithic scale is very hard to comprehend :)
Impulses - Thursday, April 22, 2010 - link
Not sure if this is the best place to post this but as I just remembered to do so, here goes... I have no issues whatsoever with your site re-design on my desktop, it's clean, it's pretty, looks fine to me.HOWEVER, it's pretty irritating on my netbook and on my phone... On the netbook the top edge of the page simply takes up too much space and leads to more scrolling than necessary on every single page. I'm talking about the banner ad, followed by the HUGE Anandtech logo (it's bigger than before isn't it), flanked by site navigation links, and followed by several more large bars for all the product categories. Even the font's big on those things... I don't get it, seems to take more space than necessary.
Those tabs or w/e on the previous design weren't as clean looking, but they were certainly more compact. At 1024x600 I can barely see the title of the article I'm on when I'm scrolled all the way up (or not at all if I've enlarged text size a notch or two). It's not really that big a deal, but it just seems like there's a ton of wasted space around the site navigation links and the logo. /shrug
Now on to the second issue, on my phone while using Opera Mini I'm experiencing some EXTREME slowdowns when navigating your page... This is a much bigger deal, it's basically useless... Can't even scroll properly. I've no idea what's wrong, since Opera Mini doesn't even load ads or anything like that, but it wasn't happening a week or two ago either so it's not because of the site re-design itself...
It's something that has NEVER happened to me on any other site tho, they may load slow initially, but after it's open I've never had a site scrolls slowly or behave sluggishly within Opera Mini like Anandtech is doing right now... Could it be a rogue ad or something?
I load the full-version of all pages on Opera Mini all the time w/o issue, but is there a mobile version of Anandtech that might be better suited for my phone/browser combination in the meantime?