Corsair's Force SSD Reviewed: SF-1200 is Very Good
by Anand Lal Shimpi on April 14, 2010 2:27 AM ESTAnandTech Storage Bench
Note that our 6Gbps controller driver isn't supported by our custom storage bench here, so the C300 results are only offered in 3Gbps mode.
The first in our benchmark suite is a light usage case. The Windows 7 system is loaded with Firefox, Office 2007 and Adobe Reader among other applications. With Firefox we browse web pages like Facebook, AnandTech, Digg and other sites. Outlook is also running and we use it to check emails, create and send a message with a PDF attachment. Adobe Reader is used to view some PDFs. Excel 2007 is used to create a spreadsheet, graphs and save the document. The same goes for Word 2007. We open and step through a presentation in PowerPoint 2007 received as an email attachment before saving it to the desktop. Finally we watch a bit of a Firefly episode in Windows Media Player 11.
There’s some level of multitasking going on here but it’s not unreasonable by any means. Generally the application tasks proceed linearly, with the exception of things like web browsing which may happen in between one of the other tasks.
The recording is played back on all of our drives here today. Remember that we’re isolating disk performance, all we’re doing is playing back every single disk access that happened in that ~5 minute period of usage. The light workload is composed of 37,501 reads and 20,268 writes. Over 30% of the IOs are 4KB, 11% are 16KB, 22% are 32KB and approximately 13% are 64KB in size. Less than 30% of the operations are absolutely sequential in nature. Average queue depth is 6.09 IOs.
The performance results are reported in average I/O Operations per Second (IOPS):
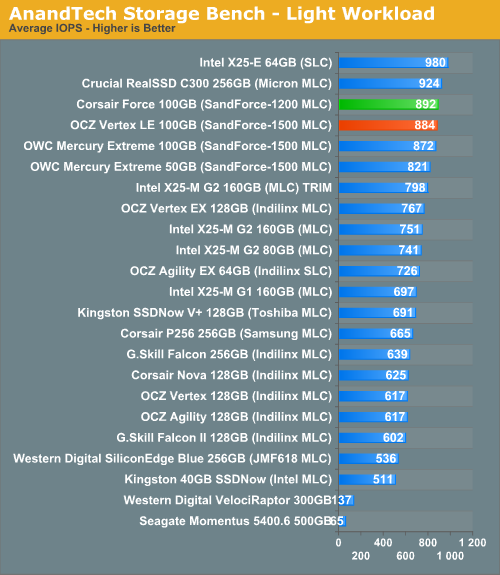
I've always loved the performance of SandForce's controllers, I've just been worried about their reliability. While we wait for the latter to prove itself over time, the performance is very good today. The Corsair Force is very competitive, as fast as any other SF drive and faster than nearly all other SSDs.
If there’s a light usage case there’s bound to be a heavy one. In this test we have Microsoft Security Essentials running in the background with real time virus scanning enabled. We also perform a quick scan in the middle of the test. Firefox, Outlook, Excel, Word and Powerpoint are all used the same as they were in the light test. We add Photoshop CS4 to the mix, opening a bunch of 12MP images, editing them, then saving them as highly compressed JPGs for web publishing. Windows 7’s picture viewer is used to view a bunch of pictures on the hard drive. We use 7-zip to create and extract .7z archives. Downloading is also prominently featured in our heavy test; we download large files from the Internet during portions of the benchmark, as well as use uTorrent to grab a couple of torrents. Some of the applications in use are installed during the benchmark, Windows updates are also installed. Towards the end of the test we launch World of Warcraft, play for a few minutes, then delete the folder. This test also takes into account all of the disk accesses that happen while the OS is booting.
The benchmark is 22 minutes long and it consists of 128,895 read operations and 72,411 write operations. Roughly 44% of all IOs were sequential. Approximately 30% of all accesses were 4KB in size, 12% were 16KB in size, 14% were 32KB and 20% were 64KB. Average queue depth was 3.59.
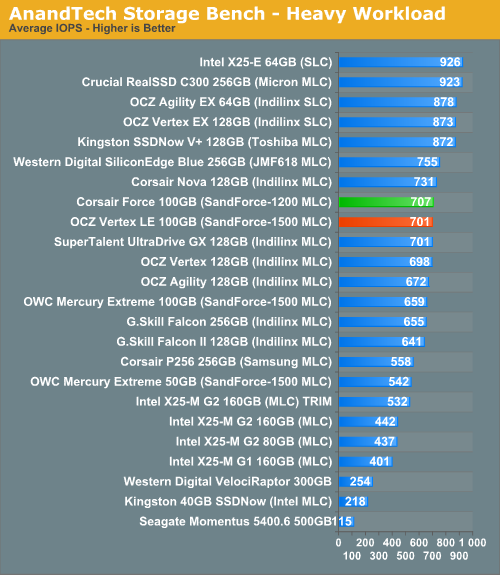
Once again, very little difference between Corsair's Force and OCZ's Vertex LE. SandForce's performance isn't as strong in our heavy downloading workload, the Corsair Nova (with the latest Indilinx firmware) actually does better.
The gaming workload is made up of 75,206 read operations and only 4,592 write operations. Only 20% of the accesses are 4KB in size, nearly 40% are 64KB and 20% are 32KB. A whopping 69% of the IOs are sequential, meaning this is predominantly a sequential read benchmark. The average queue depth is 7.76 IOs.
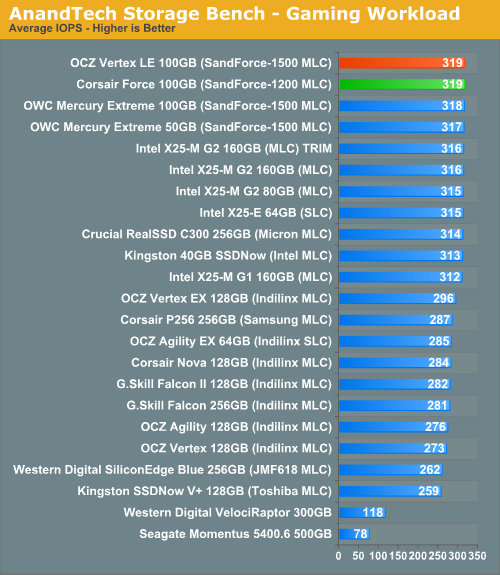
Here we're completely bound by read performance. I'm afraid the only way you'll get faster is via RAID or a 6Gbps controller in Crucial's case.


63 Comments
View All Comments
JohnQ118 - Thursday, April 15, 2010 - link
Just in case if you are using IE8 - open the Print view; then simply from the View menu select Style - No Style.You will get some small margins. Then adjust the window size as comfortable for reading.
remosito - Wednesday, April 14, 2010 - link
Hi there,thanks for the great review. I couldn't find from the article what kind of data you are writing
for the random 4k read/write tests. Those random write numbers look stellar.
Which might have to do with the data being written being not very random at all and allowing for big gain coming from the sandforce voodoo/magicsauce/compression???
Mr Alpha - Wednesday, April 14, 2010 - link
I believe the build of IOMeter he uses writes randomized data.shawkie - Wednesday, April 14, 2010 - link
This is a very important question - nobody is interested in how quickly they can write zeroes to their drive. If these benchmarks are really writing completely random data (which by definition cannot be compressed at all) then where does all this performance come from? It seems to me that we have a serious problem benchmarking this drive. If the bandwidth of the NAND were the only limiting factor (rather than the SATA interface or the processing power of the controller) then the speed of this drive should be anything from roughly the same as a similar competitor (for completely random data) to maybe 100x faster (for zeroes). So to get any kind of useful number you have to decide exactly what type of data you are going to use (which makes it all a bit subjective). In fact, there's another consideration. Note that the spare NAND capacity made available by the compression is not available to the user. That means the controller is probably using it to augment the reserved NAND. This means that a drive that has been "dirtied" with lots of nice compressable data will perform as though it has a massive amount of reserved NAND whereas a drive that has been "dirtied" with lots of random data will perform much worse.nafhan - Wednesday, April 14, 2010 - link
My understanding is that completely random and uncompressible are not the same thing. An uncompressible data set would need to be small and carefully constructed to avoid repetition. A random data set by definition is random, and therefore almost certain to contain repetitions over a large enough data set.jagerman42 - Wednesday, April 14, 2010 - link
No; given a random sequence of 0/1 bits with equal probability of each, the expected number of bits to encode the stream (i.e. on average--you could, through extremely unlikely outcome, have a compressible random sequence: e.g. a stream of 1 million 0's is highly compressible, but also extremely unlikely, at 2^(-1,000,000) probability of occurrence).So onwards to the entropy bits required calculation: H = -0.5*log2(0.5) -0.5*log2(0.5) = -0.5*(-1) -0.5*(-1) = 1.
In other words, a random, equal-probability stream of bits can't be compressed at a rate better than 1 bit per bit.
Of course, this only holds for an infinite, continuous stream; as you shorten the length of the data, the probability of the data being compressible increases, at least slightly--but even 1KB is 8192 bits, so compressibility is *hard*.
Just for example's sake, I generated a few (10 bytes to 10MB) random data files, and compressed using gzip and bzip2: in every case (I repeated several times) the compressed version ended up larger than the original.
For more info on this (it's called the Shannon theory, I believe, or also "Shannon entropy" according to the following), see: http://en.wikipedia.org/wiki/Entropy_(information_...
shawkie - Wednesday, April 14, 2010 - link
I'm also not convinced by the way Anand has arrived at a compression factor of 2:1 based on the power consumption. The specification for the controller and Anand's own measurements show that about 0.57W of power is being used just by the controller. That only leaves 0.68W for writing data to NAND. Compare that with 2.49W for the Intel drive and you end up with a compression factor of more like 4:1. But actually this calculation is still a long way out because 2MB/s sequential writes are 250MB/s on the SandForce and only 100MB/s on the Intel. So we've written 2.5x as much (uncompressed) data using 1/4 as much NAND power consumption. So the compression factor is actually more like 10:1. I think that pretty much proves we're dealing with very highly compressable data.HammerDB - Wednesday, April 14, 2010 - link
That should definitely be checked, as this is the first drive where different kinds of data will perform differently. Due to the extremely high aligned random write performance, I suspect that the data written is either compressible or repeated, so the drive manages to either compress or deduplicate to a large degree.One other point regarding the IOMeter tests: the random reads perform almost identical to the unaligned random writes. Would it be possible to test both unaligned and aligned random reads, in order to find out if the drive is also capable of faster random reads under specific circumstances?
Anand Lal Shimpi - Wednesday, April 14, 2010 - link
Correct. The June 08 RC build of Iometer uses randomized data. Older versions used 0s.Take care,
Anand
shawkie - Wednesday, April 14, 2010 - link
Anand, do you therefore have any explanation for why the SandForce controller is apparently about 10x more efficient than the Intel one even on random (incompressible) data? Or can you see a mistake in my analysis?