Seagate Barracuda XT 2TB: SATA 6Gb/s Performance Preview
by Gary Key on October 29, 2009 12:00 AM EST- Posted in
- Storage
AnandTech Storage Bench Results –
Finding good, real world, storage benchmarks is next to impossible. The synthetic tests work up to a certain point but you need real world examples. Measuring performance in individual applications often ends up with charts like these where all of the drives perform identically. Benchmark suites like PCMark Vantage are the best we can do, but they are a bit too easy on these drives in my opinion and while representative of a real world environment, they aren’t necessarily representative of all real world environments.
Recently we’ve been able to get our hands on a piece of software that allows us to record all disk activity on a machine and then play it back on any other machine. The point is that we can now model a real world usage scenario without waiting for BAPCo or Futuremark to do it for us. The performance results are reported in I/O Operations per Second (IOPS).
The first in our new benchmark suite is a light usage application case. The Windows 7 system is loaded with Firefox, Office 2007 and Adobe Reader among other applications. With Firefox we browse web pages like Facebook, AnandTech, Digg and other sites. Outlook is also running and we use it to check emails, create and send a message with a PDF attachment. Adobe Reader is used to view some PDFs. Excel 2007 is used to create a spreadsheet, graphs and save the document. The same goes for Word 2007. We open and step through a presentation in PowerPoint 2007 received as an email attachment before saving it to the desktop. Finally we watch a bit of a Firefly episode in Windows Media Player 11.
There’s some level of multitasking going on here but it’s not unreasonable by any means. Generally the application tasks proceed linearly, with the exception of things like web browsing which may happen in between one of the other tasks.
The recording is played back on all of our drives here today. Remember that we’re isolating disk performance; all we’re doing is playing back every single disk access that happened in that ~5 minute period of usage. The light trace is composed of 37,501 reads and 20,268 writes. Over 30% of the IOs are 4KB, 11% are 16KB, 22% are 32KB and approximately 13% are 64KB in size. Less than 30% of the operations are absolutely sequential in nature. Average queue depth is 6.09 IOs.
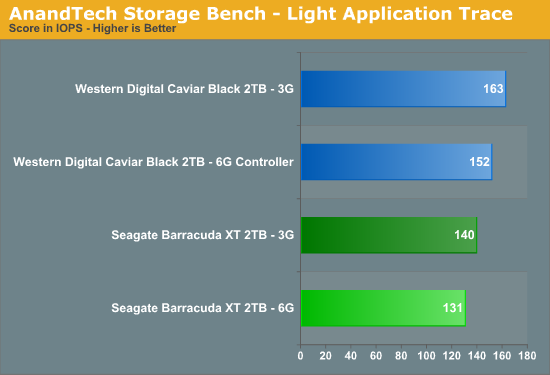
The Marvell controller is 7% slower than the Intel controller with the WD drive and once again 7% with the Seagate drive. The WD drive is up to 24% faster than the Seagate drive depending on the controller configuration.
If there’s a light usage case there’s bound to be a heavy one. In this test we have Microsoft Security Essentials running in the background with real time virus scanning enabled. We also perform a quick scan in the middle of the test. Firefox, Outlook, Excel, Word and Powerpoint are all used the same as they were in the light test. We add Photoshop CS4 to the mix, opening a bunch of 12MP images, editing them, then saving them as highly compressed JPGs for web publishing. Windows 7’s picture viewer is used to view a bunch of pictures on the hard drive.
We then use 7-zip to create and extract .7z archives. Downloading is also prominently featured in our heavy test; we download large files from the Internet during portions of the benchmark, as well as use uTorrent to grab a couple of torrents. Some of the applications in use are installed during the benchmark, Windows updates are also installed. Towards the end of the test we launch World of Warcraft, play for a few minutes, then delete the folder. This test also takes into account all of the disk accesses that happen while the OS is booting.
The benchmark is 22 minutes long and it consists of 128,895 read operations and 72,411 write operations. Roughly 44% of all IOs were sequential. Approximately 30% of all accesses were 4KB in size, 12% were 16KB in size, 14% were 32KB and 20% were 64KB. Average queue depth was 3.59.
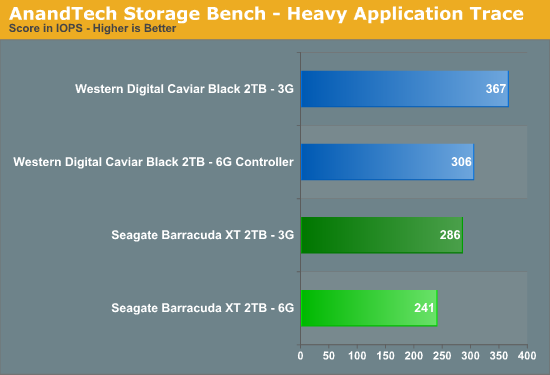
The Marvell controller is 19% slower than the Intel controller with the WD drive and 18% with the Seagate drive. The WD drive is up to 28% faster than the Seagate drive.
Our final test focuses on actual gameplay in four 3D games: World of Warcraft, Batman: Arkham Asylum, FarCry 2 and Risen, in that order. The games are launched and played, altogether for a total of just under 30 minutes. The benchmark measures game load time, level load time, disk accesses from saved games and normal data streaming during game play.
The gaming trace is made up of 75,206 read operations and only 4,592 write operations. Only 20% of the accesses are 4KB in size, nearly 40% are 64KB and 20% are 32KB. A whopping 69% of the IOs are sequential, meaning this is predominantly a sequential read benchmark. The average queue depth is 7.76 IOs.
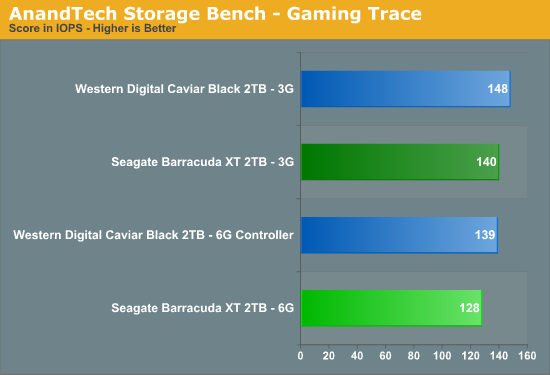
Not much else to say here, the Marvell controller is 6% slower than the Intel controller with the WD drive and 9% with the Seagate drive. The WD drive is up to 8% faster than the Seagate drive.


55 Comments
View All Comments
Transisto - Thursday, October 29, 2009 - link
Port multiplier technology are often used for external raid unit over a single Esata.That would be a good use,
As for the article,,,,,,, did someone at Anand really though a "nothing special" HDD would saturate 3Gb/s ? I wonder if even 5% of readers though so.
Captainbob001 - Thursday, October 29, 2009 - link
I agree with the other writers on here, no need for sata 6gb/s. I believe we are at the mechanical limit with 3 gb/s sata with spinning platters. I believe we will see differences when SSD starts utilizing it. Right now drives in raid0 configuration get much better mb/s times than these tests.Concillian - Friday, October 30, 2009 - link
We aren't necessarily at any limit, just that controller throughput is always well ahead of hard drive throughput. This has been the case since we had hard drive controllers installed in the ISA bus. It's always some great new throughput of the controller that the hard drives can't take advantage of yet.It's still a good thing though, because you don't want to be in the case where you have a traffic jam on your 2 lane highway 100% of the time before you add a new lane. If that were the case all the drives now would be on PATA/100. It's much better when the controller leaps are not very exciting. The manufacturers are doing their job if controller throughput leaps aren't exciting.
zephyrprime - Thursday, October 29, 2009 - link
Pcie 1.0 was 250mb/s for each lane but isn't pcie 2.0 500mb/s for each lane? I would think a p55 board would have pcie 2.0, right?
kureshii - Thursday, October 29, 2009 - link
IIRC the P55's PCIe lanes are 2.0-specced, but bandwidth-limited to PCIe 1.1 speeds to prevent choking up the DMI bus.chizow - Thursday, October 29, 2009 - link
That's also correct from what I've read, the P55 is PCIE 2.0 but the ICH10R is only PCIE 1.1. It could very well be an attempt to prevent choking up the DMI bus, but knowing Intel, I wouldn't doubt it if the decision was made so X58 and P55 wouldn't feature-compete with each other or offer a competitive advantage to outside solutions before they rolled out their own native SATA 6.0 and USB 3.0 solution. That's really why we're seeing all these workarounds to begin with, because Intel has been dragging their feet on adopting and implementing these specs.JarredWalton - Thursday, October 29, 2009 - link
The catch is that PCI-E 1.x is 250MB/s aggregate bandwidth, but half of that is upstream and half is downstream. So the 500MB/s figure for two PCI-E 2.0 lanes is correct in that the maximum rate to or from the drive would be 500MB/s.Griswold - Thursday, October 29, 2009 - link
Get a port multiplier and hook up 4 of them per channel - watch the bandwith put to good use, if you actually need it.Now do the same with all the other ports and you got a, for a desktop system, ridiculous amount of storage capacity with all disks capable of operating at their best sequential read/write performance.
:P
yyrkoon - Thursday, October 29, 2009 - link
A good SAS controller would trump port multipliers using 2 channels cascaded.Griswold - Thursday, October 29, 2009 - link
Yea, just that nobody is talking about SAS in this context...