Real-world virtualization benchmarking: the best server CPUs compared
by Johan De Gelas on May 21, 2009 3:00 AM EST- Posted in
- IT Computing
Heavy Virtualization Benchmarking
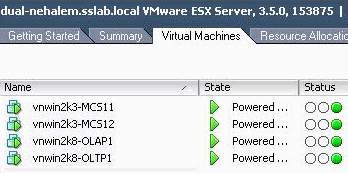
All tests run on ESX 3.5 Update 4 (Build 153875), which has support for AMD's RVI. It also supports the Intel Xeon X55xx Nehalem but has no support yet for EPT.
Getting one score out of a virtualized machine is not straightforward: you cannot add up URL/s, transactions per second, and queries per second. If virtualized system A turns out twice as many web responses but fails to deliver half of the transactions machine B delivers, which one is the fastest? Luckily for us, Intel (vConsolidate) and VMware (VMmark) have already solved this problem. We use a very similar approach. First, we test each application on its native operating system with four physical cores. Those four physical cores belong to one Opteron Shanghai 8389 2.9GHz. This becomes our reference score.
| Opteron Shanghai 8389 2.9GHz Reference System | |
| Test | Reference score |
| OLAP - Nieuws.be | 175.3 Queries /s |
| Web portal - MCS | 45.8 URL/s |
| OLTP - Calling Circle | 155.3 Transactions/s |
We then divide the score of the first VM by the "native" score. In other words, divide the number of queries per second in the first OLAP VM by the number of queries that one Opteron 8389 2.9GHz gets when it is running the Nieuws.be OLAP Database.
| Performance Relative to Reference System | ||||
| Server System Processors | OLAP VM | Web portal VM 2 | Web portal VM 3 | OLTP VM |
| Dual Xeon X5570 2.93 | 94% | 50% | 51% | 59% |
| Dual Xeon X5570 2.93 HT off | 92% | 43% | 43% | 43% |
| Dual Xeon E5450 3.0 | 82% | 36% | 36% | 45% |
| Dual Xeon X5365 3.0 | 79% | 35% | 35% | 32% |
| Dual Xeon L5350 1.86 | 54% | 24% | 24% | 20% |
| Dual Xeon 5080 3.73 | 47% | 12% | 12% | 7% |
| Dual Opteron 8389 2.9 | 85% | 39% | 39% | 51% |
| Dual Opteron 2222 3.0 | 50% | 17% | 17% | 12% |
So for example, the OLAP VM on the dual Opteron 8389 got a score of 85% of that of the same application running on one Opteron 8389. As you can see the web portal server only has 39% of the performance of a native machine. This does not mean that the hypervisor is inefficient, however. Don't forget that we gave each VM four virtual CPUs and that we have only eight physical CPUs. If the CPUs are perfectly isolated and there was no hypervisor, we would expect that each VM gets 2 physical CPUs or about 50% of our reference system. What you see is that OLAP VM and OLTP VM "steal" a bit of performance away from the web portal VMs.
Of course, the above table is not very user-friendly. To calculate one vApus Mark I score per physical server we take the geometric mean of all those percentages, and as we want to understand how much work the machine has done, we multiply it by 4. There is a reason why we take the geometric mean and not the arithmetic mean. The geometric mean penalizes systems that score well on one VM and very badly on another VM. Peaks and lows are not as desirable as a good steady increase in performance over all virtual machines, and the geometric mean expresses this. Let's look at the results.
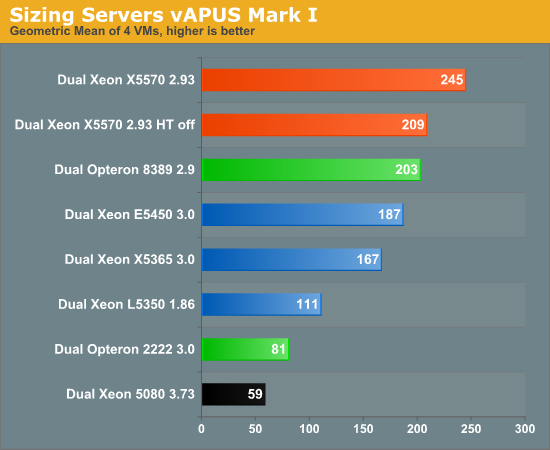
After seeing so many VMmark scores, the result of vApus Mark I really surprised us. The Nehalem based Xeons are still the fastest servers, but do not crush the competition as we have witnessed in VMmark and VConsolidate. Just to refresh your memory, here's a quick comparison:
| VMmark vs. vApus Mark I Summary | ||
| Comparison | VMmark | vApus Mark I |
| Xeon X5570 2.93 vs. Xeon 5450 3.0 | 133-184% faster (*) | 31% faster |
| Xeon X5570 2.93 vs. Opteron 8389 2.9 | +/- 100% faster (*)(**) | 21% faster |
| Opteron 8389 2.9 vs. Xeon 5450 3.0 | +/- 42% | 9% faster |
(*) Xeon X5570 results are measured on ESX 4.0; the others are on ESX 3.5.
(**) Xeon X5570 best score is 108% faster than Opteron at 2.7GHz. We have extrapolated the 2.7GHz scores to get the 2.9GHz ones.
Our first virtualization benchmark disagrees strongly with the perception that the large OEMs and recent press releases have created with the VMmark scores. "Xeon 54xx and anything older are hopelessly outdated virtualization platforms, and the Xeon X55xx make any other virtualization platform including the latest Opteron 'Shanghai' look silly". That is the impression you get when you quickly glance over the VMmark scores.
However, vApus Mark I tells you that you should not pull your older Xeons and newer Opterons out of your rack just yet if you are planning to continue to run your VMs on ESX 3.5. This does not mean that either vApus Mark I or VMmark is wrong, as they are very different benchmarks, and vApus Mark I was run exclusively on ESX 3.5 update 4 while some of the VMmark scores have been run on vSphere 4.0. What it does show us how important it is to have a second data point and a second independent "opinion". That said, the results are still weird. In vApus Mark I, Nehalem is no longer the ultimate, far superior virtualization platform; at the same time, the Shanghai Opteron does not run any circles around the Xeon 54xx. There is so much to discuss that a few lines will not do the job. Let's break things up a bit more.


66 Comments
View All Comments
GotDiesel - Thursday, May 21, 2009 - link
"Yes, this article is long overdue, but the Sizing Server Lab proudly presents the AnandTech readers with our newest virtualization benchmark, vApus Mark I, which uses real-world applications in a Windows Server Consolidation scenario."spoken with a mouth full of microsoft cock
where are the Linux reviews ?
not all of us VM with windows you know..
JohanAnandtech - Thursday, May 21, 2009 - link
A minimum form of politeness would be appreciated, but I am going to assume your were just dissapointed.The problem is that right now the calling circle benchmark runs half as fast on Linux as it does on Windows. What is causing Oracle to run slower on Linux than on Windows is a mystery even to some of the experienced DBA we have spoken. We either have to replace that benchmark with an alternative (probably Sysbench) or find out what exactly happened.
When you construct a virtualized benchmark it is not enough just to throw in a few benchmarks and VMs, you really have to understand the benchmark thoroughly. There are enough halfbaken benchmarks already on the internet that look like a Swiss cheese because there are so many holes in the methodology.
JarredWalton - Thursday, May 21, 2009 - link
Page 4: vApus Mark I: the choices we made"vApus mark I uses only Windows Guest OS VMs, but we are also preparing a mixed Linux and Windows scenario."
Building tests, verifying tests, running them on all the servers takes a lot of time. That's why the 2-tile and 3-tile results are not yet ready. I suppose Linux will have to wait for Mark II (or Mark I.1).
mino - Thursday, May 21, 2009 - link
What you did so far is great. No more words needed.What I would like to see is vApus Mark I "small" where you make the tiles smaller, about 1/3 to 1/4 of your current tiles.
Tile structure shall remain simmilar for simplicity, they will just be smaller.
When you manage to have 2 different tile sizes, you shall be able to consider 1 big + 1 small tile as one "condensed" tile for general score.
Having 2 reference points will allow for evaluating "VM size scaling" situations.
JohanAnandtech - Sunday, May 24, 2009 - link
Can you elaborate a bit? What do you menan by "1/3 of my current tile?" . A tile = 4 VMs. are you talking about small mem footprint or number of VCPUs?Are you saying we should test with a Tile with small VMs and then test afterwards with the large ones? How do you see such "VM scaling" evaluation?
mino - Monday, May 25, 2009 - link
Thanks for response.1/3 I mean smaller VM's. Mostly from the load POW. Probably 1/3 load would go for 1/2 memory footprint.
The point being that currently the is only a single datapont with a specific load-size per tile/per VM.
By "VM scaling" I would like to see what effect woul smaller loads have on overal performance.
I suggest 1/3 or 1/4 the load to get a measurable difference while remaining within reasonable memory/VM scale.
In the end, if you get simmilar overal performance from 1/4 tiles, it may not make sense to include this in future.
Even then the information that your benchmark results can be safely extrapolated to smaller loads would be of a great value by itself.
mino - Monday, May 25, 2009 - link
Eh, that last text of mime looks like a nice gibberish...Clarification nneded:
To be able to run more tiles/box smaller memory footprint is a must.
With smaller mem footprint, smaller DB's are a must.
The end results may not be directly comparable but shall be able to give some reference point, corectly interpreted
Please let me know if this makes sense to you.
There are multiple dimensions to this. I may be easily on the imaginery branch :)
ibb27 - Thursday, May 21, 2009 - link
Can we have a chance to see benchmarks for Sun Virtualbox which is Opensource?winterspan - Tuesday, May 26, 2009 - link
This test is misleading because you are not using the latest version of VMware that supports Intel's EPT. Since AMD's version of this is supported in the older version, the test is not at all a fair representation of their respective performance.Zstream - Thursday, May 21, 2009 - link
Can someone please perform a Win2008 RC2 Terminal Server benchmark? I have been looking everywhere and no one can provide that.If I can take this benchmark and tell my boss this is how the servers will perform in a TS environment please let me know.