Real-world virtualization benchmarking: the best server CPUs compared
by Johan De Gelas on May 21, 2009 3:00 AM EST- Posted in
- IT Computing
Heavy Virtualization Benchmarking
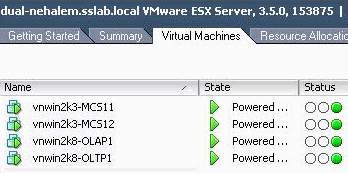
All tests run on ESX 3.5 Update 4 (Build 153875), which has support for AMD's RVI. It also supports the Intel Xeon X55xx Nehalem but has no support yet for EPT.
Getting one score out of a virtualized machine is not straightforward: you cannot add up URL/s, transactions per second, and queries per second. If virtualized system A turns out twice as many web responses but fails to deliver half of the transactions machine B delivers, which one is the fastest? Luckily for us, Intel (vConsolidate) and VMware (VMmark) have already solved this problem. We use a very similar approach. First, we test each application on its native operating system with four physical cores. Those four physical cores belong to one Opteron Shanghai 8389 2.9GHz. This becomes our reference score.
| Opteron Shanghai 8389 2.9GHz Reference System | |
| Test | Reference score |
| OLAP - Nieuws.be | 175.3 Queries /s |
| Web portal - MCS | 45.8 URL/s |
| OLTP - Calling Circle | 155.3 Transactions/s |
We then divide the score of the first VM by the "native" score. In other words, divide the number of queries per second in the first OLAP VM by the number of queries that one Opteron 8389 2.9GHz gets when it is running the Nieuws.be OLAP Database.
| Performance Relative to Reference System | ||||
| Server System Processors | OLAP VM | Web portal VM 2 | Web portal VM 3 | OLTP VM |
| Dual Xeon X5570 2.93 | 94% | 50% | 51% | 59% |
| Dual Xeon X5570 2.93 HT off | 92% | 43% | 43% | 43% |
| Dual Xeon E5450 3.0 | 82% | 36% | 36% | 45% |
| Dual Xeon X5365 3.0 | 79% | 35% | 35% | 32% |
| Dual Xeon L5350 1.86 | 54% | 24% | 24% | 20% |
| Dual Xeon 5080 3.73 | 47% | 12% | 12% | 7% |
| Dual Opteron 8389 2.9 | 85% | 39% | 39% | 51% |
| Dual Opteron 2222 3.0 | 50% | 17% | 17% | 12% |
So for example, the OLAP VM on the dual Opteron 8389 got a score of 85% of that of the same application running on one Opteron 8389. As you can see the web portal server only has 39% of the performance of a native machine. This does not mean that the hypervisor is inefficient, however. Don't forget that we gave each VM four virtual CPUs and that we have only eight physical CPUs. If the CPUs are perfectly isolated and there was no hypervisor, we would expect that each VM gets 2 physical CPUs or about 50% of our reference system. What you see is that OLAP VM and OLTP VM "steal" a bit of performance away from the web portal VMs.
Of course, the above table is not very user-friendly. To calculate one vApus Mark I score per physical server we take the geometric mean of all those percentages, and as we want to understand how much work the machine has done, we multiply it by 4. There is a reason why we take the geometric mean and not the arithmetic mean. The geometric mean penalizes systems that score well on one VM and very badly on another VM. Peaks and lows are not as desirable as a good steady increase in performance over all virtual machines, and the geometric mean expresses this. Let's look at the results.
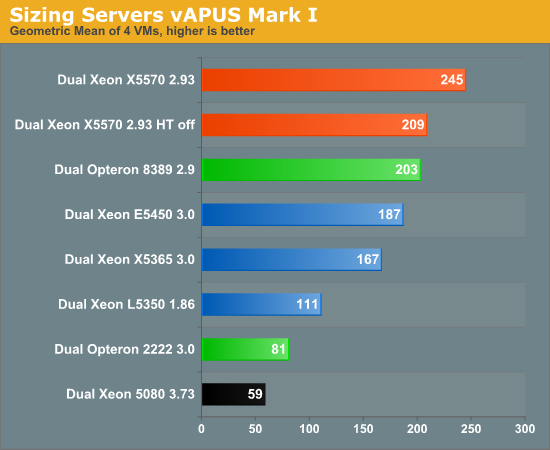
After seeing so many VMmark scores, the result of vApus Mark I really surprised us. The Nehalem based Xeons are still the fastest servers, but do not crush the competition as we have witnessed in VMmark and VConsolidate. Just to refresh your memory, here's a quick comparison:
| VMmark vs. vApus Mark I Summary | ||
| Comparison | VMmark | vApus Mark I |
| Xeon X5570 2.93 vs. Xeon 5450 3.0 | 133-184% faster (*) | 31% faster |
| Xeon X5570 2.93 vs. Opteron 8389 2.9 | +/- 100% faster (*)(**) | 21% faster |
| Opteron 8389 2.9 vs. Xeon 5450 3.0 | +/- 42% | 9% faster |
(*) Xeon X5570 results are measured on ESX 4.0; the others are on ESX 3.5.
(**) Xeon X5570 best score is 108% faster than Opteron at 2.7GHz. We have extrapolated the 2.7GHz scores to get the 2.9GHz ones.
Our first virtualization benchmark disagrees strongly with the perception that the large OEMs and recent press releases have created with the VMmark scores. "Xeon 54xx and anything older are hopelessly outdated virtualization platforms, and the Xeon X55xx make any other virtualization platform including the latest Opteron 'Shanghai' look silly". That is the impression you get when you quickly glance over the VMmark scores.
However, vApus Mark I tells you that you should not pull your older Xeons and newer Opterons out of your rack just yet if you are planning to continue to run your VMs on ESX 3.5. This does not mean that either vApus Mark I or VMmark is wrong, as they are very different benchmarks, and vApus Mark I was run exclusively on ESX 3.5 update 4 while some of the VMmark scores have been run on vSphere 4.0. What it does show us how important it is to have a second data point and a second independent "opinion". That said, the results are still weird. In vApus Mark I, Nehalem is no longer the ultimate, far superior virtualization platform; at the same time, the Shanghai Opteron does not run any circles around the Xeon 54xx. There is so much to discuss that a few lines will not do the job. Let's break things up a bit more.


66 Comments
View All Comments
has407 - Sunday, May 24, 2009 - link
Thanks very much for the additional data points, and especially for providing details. Still digesting your data (thanks again!), but a few thoughts...1. At the risk of being pedantic... Both VMark and vAplus scores are dimensionless. It would be better to avoid terms such as "faster" to describe them; IMHO, that has lead to distraction (or *cough* in some cases *cough* irrationality). Is a car that can move 5 people at 160KPH "faster" than a bus that can move 20 people at 80KPH? Maybe sticking to terms such as "throughput" or simply "performance" would be better.
2. While the geometric mean provides a nice single score, I hope you will continue to publish the detailed numbers that contribute to it (as done with VMark disclosures). The individual scores provide important clues as to whether a closer look is warranted, whether of the workload mix, the CPU, or the hypervisor.
For example, the sum of the workload (or arithmetic mean * 4) provides total overall throughput, which is an important indicator; in an ideal world that should match the geometric mean. A significant difference between those suggests a closer look is warranted.
E.g., Unless you have a workload mix that can soak up extra CPU cycles, the Xeon 5080 and to a lesser extent the Opteron 2222 don't look like good choices. For the 5080, the CPU-intensive OLAP VM contributes 60% to the result, whereas the others tend to be ~40-45%, and the difference between the geometric and arithmetic mean for the 5080 is 19%, whereas for the rest it's <14%.
3. Note what happens if you pull the CPU-intensive OLAP VM out of the picture. While I can't empirically test that, and I'm using a bit of a sledgehammer here... Eliminate it from the scoring and see what happens: the difference between the geometric and arithmetic mean drops to ~1% across the board.
Moreover, the ratio of the scores with and without the OLAP VM is quite constant, with a correlation > 0.999. The outliers again, but not by all that much, being the Xeon 5080 and the Opteron 2222, and to a lesser extent the Xeon L5350.
4. In short, I'm not sure what the addition of a CPU-intensive VM such as OLAP is adding to the picture, other than soaking up CPU cycles and some memory. A CPU-intensive VM is the easiest (or should be the easiest) for a hypervisor to handle, and appears to tell us little more than what idle time figures would tell us. In the case of the Xeon 5080 and Opteron 2222, it also appears to inflate their overall score (whether due to the processor or hypervisor, or more likely a combination of the two, is unclear).
5. That said, maybe it would be good to include a CPU-intensive VM in the mix, if for no other reason than to highlight those systems or hypervisors where that VM scores higher or lower than expected (e.g., the Xeon 5080 and Opteron 2222). However, I'd bet you can achieve the same result with a lot less work using a simpler synthetic CPU/memory-intensive test in the VM.
OTOH, maybe artificially driving CPU utilization towards 100% with such CPU-intensive VM's doesn't really tell us much more than we'd know without them--as IMHO my admittedly crude analysis suggests--and that vAplus might be a better indicator for those looking for clues as to appropriate workload allocation among virtualized systems, rather than those looking for a single magic number to quantify performance.
JohanAnandtech - Tuesday, May 26, 2009 - link
"However, I'd bet you can achieve the same result with a lot less work using a simpler synthetic CPU/memory-intensive test in the VM. "That would eliminate the network traffic. While the "native" running database is not making the OS kernel sweat, the hypervisor does get some work from the network, and thus this VM influences the scores of the other VMs. It is not a gigantic effect but it is there. And remember, we want to keep control of what happens in our VMs. Once you start running synthetic benches, you have no idea what kind of instructions are run. SQL server is closed source too, but at least we know that the instructions which will be send to the CPU will be the same as in the real world.
We will of course continue to publish all the different scores so that our inquisitive readers can make their minds :-). Nothing worse than people who quickly gloss over the graphs and than start ranting ;-).
Thanks for the elaborate comment, although I am still not sure why you would remove the OLAP database. The fact that the 4 core machines (Dempsey, dualcore opteron) do not have a lot of cycles left for the other VMs illustrates what happens in an oversubscribed system where one VM demands a lot of CPU power.
has407 - Wednesday, May 27, 2009 - link
Johan -- My thought was not so much whether to get rid of the OLAP VM, than whether a simpler CPU-intensive VM would suffice, synthetic or otherwise. However, that's probably an academic question at this point, as you've already got it the mix. (And a question I probably spent too much time thinking-out-loud about in my post. :)The other arguably more important questions are whether including CPU-intensive VM's (OLAP or synthetic) in order to drive CPU utilization to 100% easier--especially as it is 25% of the workload--provides significant additional information, and whether is more representative than the VMark approach.
That's a much harder question to answer, and far more difficult to model. Real-world benchmarks may be desirable and necessary, but they are not sufficient; a representative and real-world workload mix is also needed. What constitutes a "representative and real-world" mix is of course the Big Question.
I'll spare everyone more thinking-out-loud on that subject :), other than to say that benchmarks should help us understand how to characterize and model to more accurately predict performance. Without that we end up with lots of data (snapshots of workload X on hardware Y), but little better formal or rigorous understanding as to why. (One area where synthetic- or micro-benchmarks can help provide insight, as much as they might be derided. And one reason IMHO why what passes for most benchmarking today contributes more noise than signal. But that's another subject.)
In any case, it's good to have vApus to provide additional data points and as a counterpoint to VMark. Thanks again. Looking forward to the next round of data.
has407 - Monday, May 25, 2009 - link
Sorry, fourth column in table labeled "B:GM" (duplicate of third column label) should be "B:AM".has407 - Monday, May 25, 2009 - link
p.s. here's the numbers on which that post was based, calculated using your raw data...A - With OLAP VM
B - Without OLAP VM
GM - Geometric mean
AM - Arithmetic mean
- A:GM -- geometric mean of all four VM's * 4
- A:AM -- arithmetic mean of all four VM's * 4 (or the sum of the individual scores).
- B:GM -- geometric mean of the three VM's excluding the OLAP VM * 3.
- B:AM -- arithmetic mean of the three VM's excluding OLAP * 3 (or the sum of the individual scores excluding the OLAP VM).
A:GM A:AM B:GM B:GM A:GM/B:GM
2.03 2.14 1.28 1.29 1.58 Dual Opteron 8389 2.9
2.45 2.54 1.60 1.60 1.54 Dual Xeon X5570 2.93
2.08 2.21 1.29 1.29 1.61 Dual Xeon X5570 2.93 HT off
1.87 1.99 1.16 1.17 1.61 Dual Xeon E5450 3.0
1.68 1.81 1.02 1.02 1.65 Dual Xeon X5365 3.0
1.12 1.22 0.68 0.68 1.66 Dual Xeon L5350 1.86
0.59 0.78 0.30 0.31 1.96 Dual Xeon 5080 3.73
0.82 0.96 0.45 0.46 1.80 Dual Opteron 2222 3.0
Correlation( A:GM, B:GM ): 0.9993
Hope that helps explains my conclusions.
solori - Friday, May 22, 2009 - link
I'm glad to see Johan's team has gone beyond the "closed" VMmark standard with a Windows-based benchmark and I hope this leads to more sanity-checking of results down the line. However, the first step is verifying the process before you get to the results. Here's an example of where you're leaving some issues dangling:"However, the web portal (MCS eFMS) will give the hypervisor a lot of work if Hardware Assisted Paging (RVI, NPT, EPT) is not available. If EPT or RVI is available, the TLBs (Translation Lookaside Buffer) of the CPUs will be stressed quite a bit, and TLB misses will be costly."
This implies RVI is defaulted for 32-bit VM's. VMware's default for 32-bit virtual machines is BT (binary-translation) and not RVI, even though VROOM! tests show a clear advantage for RVI over BT for most 32-bit workloads. While you effectively discuss the affects of disabling RVI in the 64-bit case, you're unclear about "forcing" RVI in the 32-bit case. Are you saying that AMD-v and RVI are enabled for the 32-bit workloads by default? VMware's guidance states otherwise:
"By default, ESX automatically runs 32bit VMs (Mail, File, and Standby) with BT, and runs 64bit VMS (Database, Web, and Java) with AMD-V + RVI."
- VROOM! Blog, http://blogs.vmware.com/performance/2009/03/perfor...">http://blogs.vmware.com/performance/200...uation-o...
This guidance is echoed in the latest VI3.5 Performance Guide Release:
"RVI is supported beginning with ESX 3.5 Update 1. By default, on AMD processors that support it ESX Update 1 uses RVI for virtual machines running 64-bit guest operating systems and does not use RVI for virtual machines running 32-bit guest operating systems.
Although RVI is disabled by default for virtual machines running 32-bit guest operating systems, enabling it for certain 32-bit operating systems may achieve performance benefits similar to those achieved for 64-bit operating systems. These 32-bit operating systems include Windows 2003 SP2, Windows Vista, and Linux.
When RVI is enabled for a virtual machine we recommend you also?when possible?configure that virtual machine?s guest operating system and applications to make use of large memory pages."
- Performance Best Practices and Benchmarking Guidelines, VMware, Inc. (page 18)
Your chart on page 9 further indicates "SVM + RVI" for 32-bit hosts, but there is no mention of steps you took to enable RVI. This process is best described by the Best Practices Guide:
"If desired, however, this can be changed using the VI Client by selecting the virtual machine to be configured, clicking Edit virtual machine settings, choosing the Options tab, selecting Virtualized MMU, and selecting the desired radio button. Force use of these features where available enables RVI, Forbid use of these features disables RVI, and Allow the host to determine automatically results in the default behavior described above."
- Performance Best Practices and Benchmarking Guidelines, VMware, Inc. (page 18)
So, which is it: 32-bit without RVI or undocumented changes to the VMM according to VMware guidance? If it is the former, the conclusions are misleading (as stated); if the latter, such modifications should be stated explicitly since they do not represent the "typical" or "default" configuration for 32-bit guests. This oversight does not invalidate the results of the test by any means, it simply makes them more difficult to interpret.
That said, a good effort! You may as well contrast 32-bit w & w/o RVI - those results might be interesting too. I know you guys probably worked VERY hard to get these results out, and I'd like to see more, despite what "tshen83" thinks :-)
Collin C. MacMillan -- http://solori.wordpress.com">http://solori.wordpress.com
JohanAnandtech - Sunday, May 24, 2009 - link
Hi Collin,I was under the impression that ESX now choses RVI+SVM automatically, but that might have been ESX 4.0. I am going to check again on monday, but I am 99.9% sure we have enabled RVI in most tests (unless indicated otherwise) as it is a best performance practice for the Opterons.
alpha754293 - Friday, May 22, 2009 - link
Another excellent, thorough, well researched article.Thanks! :o)
JohanAnandtech - Sunday, May 24, 2009 - link
You are most welcome. Thx for letting us know!knutjb - Monday, May 25, 2009 - link
Thanks for presenting another point of view. When I read the original article showing the new Xeons so far ahead, I was skeptical. Rarely does a company produce a product that is such a huge leap, not only over their competitors, over their own products too. When there is only one primary benchmark the results can be skewed. Also, the wide variety of software combinations is eyepopping so it is very time consuming to create a resonable balance using real databaeses for a different, but valid benchmark.Thanks for the hard work, I look forward to reading more on this subject.