Gigabyte GA-EP45-UD3P - P45 at its Finest
by Gary Key on February 3, 2009 12:15 AM EST- Posted in
- Motherboards
SATA Performance
PCMark Vantage is the latest benchmark available from Futuremark, and it is only for use with Windows Vista. Similar to the venerable PCMark05 in its makeup, Vantage modernizes the criteria and test methodology to reflect what users may encounter when running the new Windows OS and current applications. The total HDD benchmark is roughly 87% reads and 13% writes in nature. We run each test five times per drive, producing a median score that we use for comparison in our charts. We enable AHCI settings for each board and download the latest driver set from the manufacturer.
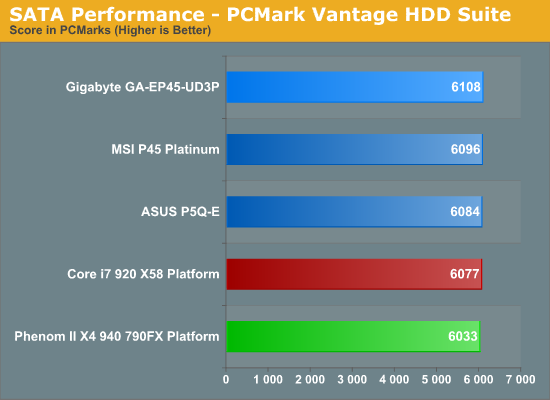
All of the P45 boards utilize the ICH10R for primary storage duties, so there is little difference between the results. ASUS normally finishes first in our storage tests but GIGABYTE was able to pull slightly ahead with the GA-EP45-UD3P.
USB / FireWire Performance
Our USB transfer speed tests are conducted with an OCZ Rally 2 Turbo 4GB Flash Drive and USB 2.0/FireWire based Maxtor OneTouch II external hard drive. In the small file test, we transfer a 602MB folder containing 444 files of various sizes from our hard drive to the USB Flash drive. In the large file test, we transfer a 1.90GB file folder containing 17 different files from our hard drive to the external drive utilizing the USB 2.0 and IEEE 1394a interface.
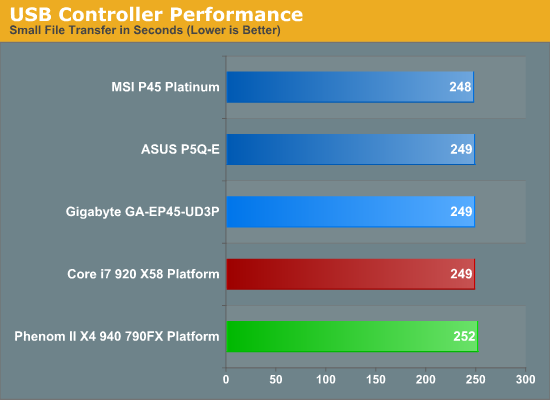
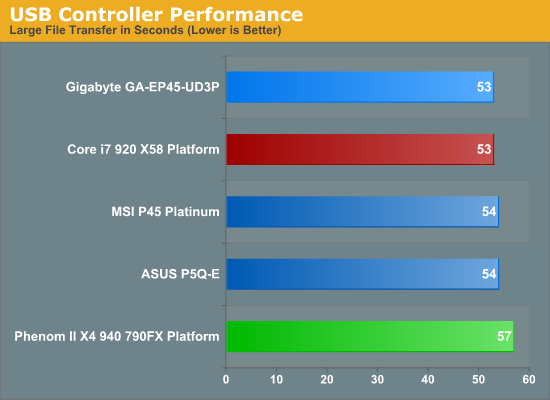
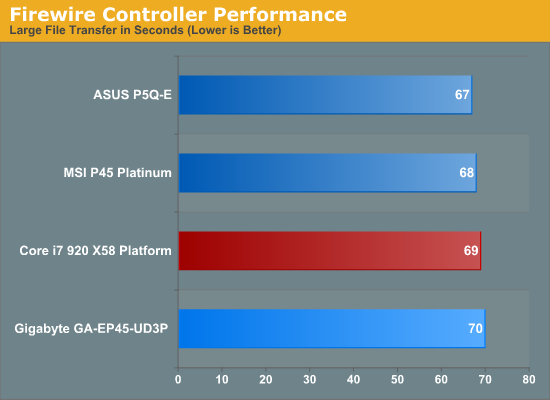
USB performance is a wash since all of the P45 boards use the same ICH10R chipset that provides the USB capabilities. While our synthetic HD Tune tests indicate parity between the boards, the actual transfer of files in the small file test indicates a slight advantage to MSI's implementation. Our large file USB test basically results in a tie as we are comparing the same chipset and the external hard drive becomes the limiting factor. The VIA and LSI FireWire solutions on the MSI and ASUS boards hold a small advantage over the Texas Instruments chipset on the GIGABYTE board.
Networking
The Windows 2000 Driver Development Kit (DDK) includes a useful LAN testing utility called NTttcp. We used the NTttcp tool to test Ethernet throughput and the CPU utilization of the various Ethernet Controllers used on the Intel motherboards. We set up one machine as the server; in this test, an Intel system with an Intel CSA Gigabit LAN connection. Intel CSA has a reputation for providing fast throughput and is a logical choice for our Gigabit LAN server.
On the server side, we used the following Command Line as suggested by the VIA whitepaper on LAN testing:
Ntttcpr -m 4,0,‹server IP› -a 4 -l 256000 -n 30000
On the client side (the motherboard under test), we used the following Command Line:
Ntttcps -m 4,0,‹client IP› -a 4 -l 256000 -n 30000
At the conclusion of the test, we captured the throughput and CPU utilization figures from the client screen.
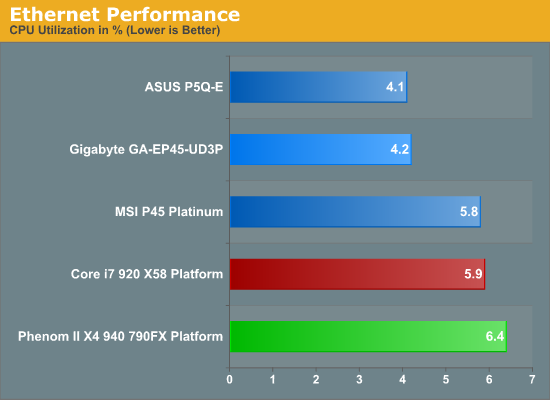
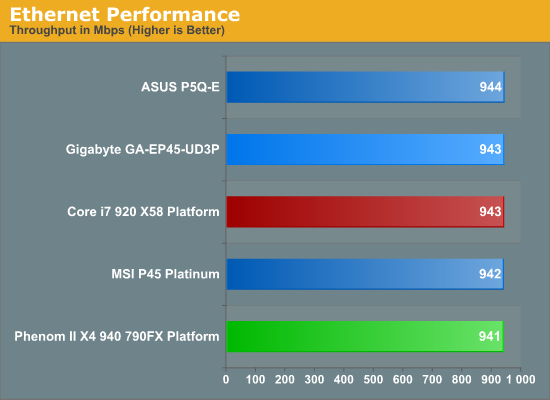
Our network throughput test indicates how well a particular controller design from Realtek, Marvell, or Intel performs instead of being indicative of true chipset performance. This also holds true for the CPU utilization results, though this test can also be influenced to certain degree by the BIOS code and chipset interconnect design.
The CPU utilization and throughput numbers favor the Marvell controller on the ASUS board, followed closely by the Realtek chipsets on the MSI and GIGABYTE boards. In practice, few if any users will notice a difference, even if they have the requisite gigabit hub, as storage performance frequently bottlenecks the actual transfer rates.


73 Comments
View All Comments
poohbear - Tuesday, February 3, 2009 - link
thanks for benching @ 1680x1050 so we know real world usage. hate it when they bench @ a real low rez even if there's a difference as that means nothing to 99% of ppl that game @ anything but the lower resolutions.:)crimson117 - Tuesday, February 3, 2009 - link
When they bench at low resolutions, it's to discover any CPU bottleneck. It's the equivalent of saying, "we know the GPU can handle this low res at super high framerates, so will the CPU processing the game mechanics keep the framerates down?".For example, an RTS like Supreme Commander will have okay graphics, but most of the horsepower will be the CPU calculating troop movement, damage, etc, especially on large maps with lots of players. So they'll want to take the GPU's rendering speed out of the equation and see how fast the CPU can do its gameplay calculations.
This can really help people know which part of their computer to upgrade. A friend of mine has an E6300 Conroe 1.86GHz (one of the earliest C2D's), so his CPU is pretty old. He has a 9800GT graphics card. If he wants to play Supreme Commander with 10 opponents at once, should he upgrade his graphics or his CPU?
At low resolutions, the video card can handle it no problem, but no matter what resolution, the CPU still has to calculate 10 players actions at once. If they only benchmarked at high resolution, then the graphics lag would mask the fact that the CPU calculations were also laggy. So by reducing the resolution to really low levels, he'd find out the CPU still can't keep up and should be upgraded.
zebrax2 - Tuesday, February 3, 2009 - link
seems like those polls are starting to take effect