Intel Core 2 Quad Q9550S: A New 65W Quad-Core
by Anand Lal Shimpi on January 27, 2009 8:00 PM EST- Posted in
- CPUs
Fallout 3 Game Performance
Bethesda’s latest game uses an updated version of the Gamebryo engine (Oblivion). This benchmark takes place immediately outside Vault 101. The character walks away from the vault through the Springvale ruins. The benchmark is measured manually using FRAPS.
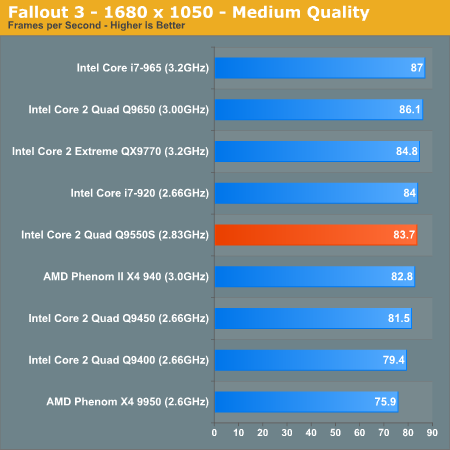
Gaming performance here is pretty well clustered around the mid 80s.
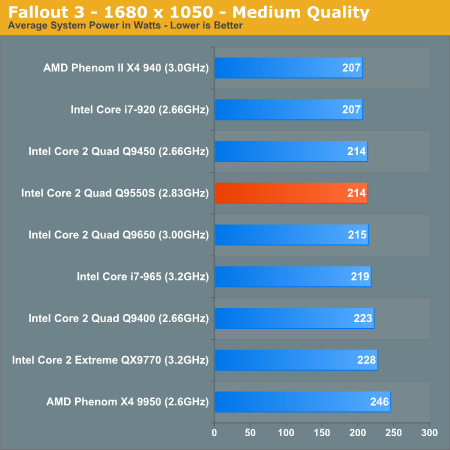
With the GPU being the big driver of power consumption here, the CPUs themselves all use a similar amount of power. The variance between similarly clocked CPUs is normal between runs.
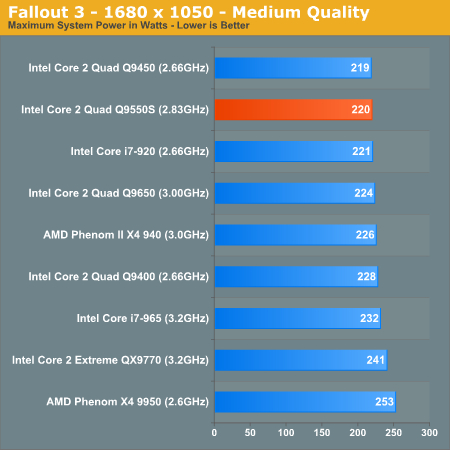
Peak power tells a similar story:
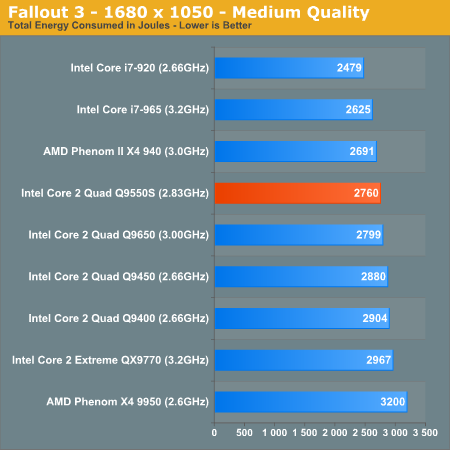
The energy efficiency graph is, however, unexpected. The Fallout 3 benchmark is a fixed time test; in other words, it takes the same amount of time to complete regardless of the system. With all benchmarks taking the same amount of time, total energy consumed should be dependent solely on average power. We’ve already seen that average power is pretty similar between the systems, so we should see some pretty even results here right?
Wrong.
While all of the Core 2 Quads consumed around 2800 - 2900J of energy the Core i7s used 2625J and 2479J for the 965 and 920, respectively. Remember that a feature of Core i7 is the ability to completely cut power to one of the cores if it’s not being used. This feature is thanks to Intel’s power gate transistors, which aren’t used in the Core 2 Quads. In a game where all four cores aren’t taxed, Core i7 can pull ahead in energy efficiency despite using a similar amount of power to the rest of the contenders.
The i7-920 actually uses less energy in this test than the lowest power quad-core Penryn we have on the chart.


62 Comments
View All Comments
mmntech - Wednesday, January 28, 2009 - link
What about the Core 2 Quad Q9100? Penryn based quad core at 2.26ghz and 45w TDP. It's ridiculously expensive though at $851.http://ark.intel.com/cpu.aspx?groupId=37033">http://ark.intel.com/cpu.aspx?groupId=37033
michael2k - Thursday, January 29, 2009 - link
I think it has to hit 35W before Apple can shove it into a MacBook. Though that would work in an iMac now.