Unreal Tournament 3 CPU & High End GPU Analysis: Next-Gen Gaming Explored
by Anand Lal Shimpi & Derek Wilson on October 17, 2007 3:35 AM EST- Posted in
- GPUs
High End GPU Performance
While a few titles based on the Unreal Engine 3 have already made their way onto the scene, the detail and atmosphere of Unreal Tournament 3 really show off what developers can do with this engine if they take the time to understand it. Between its first party titles and Bioshock, Epic certainly makes a solid statement that its Unreal Engine 3 is an excellent choice for leading edge graphics.
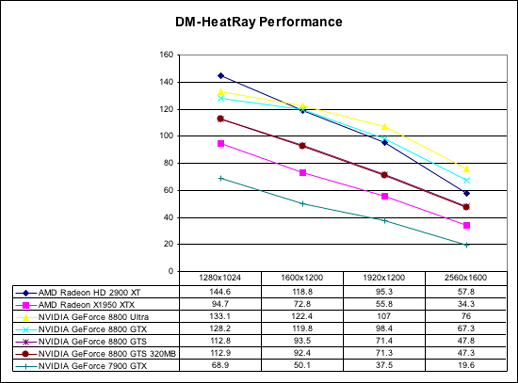
For this test, we are looking at performance scaling on high end video cards ($300+) across multiple resolutions and on multiple maps. We will absolutely be revisiting this game with midrange hardware and multiGPU configurations. In this analysis, we focus on the performance of the Suspense capture the flag map flyby. This is the most graphically intense flyby we have, and the other two maps we tested tended to exhibit similar relative performance between cards.
With our high end hardware, we've pulled out the 1920 x 1200 tests, as this is very likely to be the resolution paired with one of these parts.
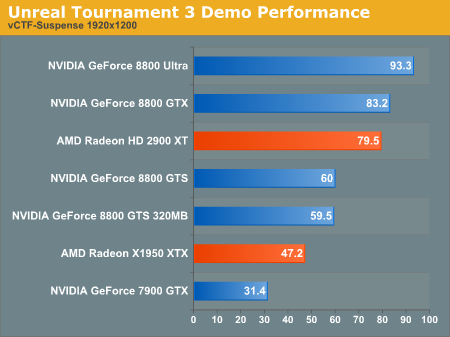
The NVIDIA GeForce 8800 GTX and Ultra both outperform the AMD Radeon HD 2900 XT, which is to be expected: the 2900 XT costs much less. But the performance gap here is not huge, and the 2900 XT gets major points for that. It handily outperforms its direct competition, the 8800 GTS (both 640MB and 320MB perform nearly identically). Not surprisingly, the X1950 XTX bests the 7900 GTX, and both of these parts perform worse than the 8800 GTS cards.
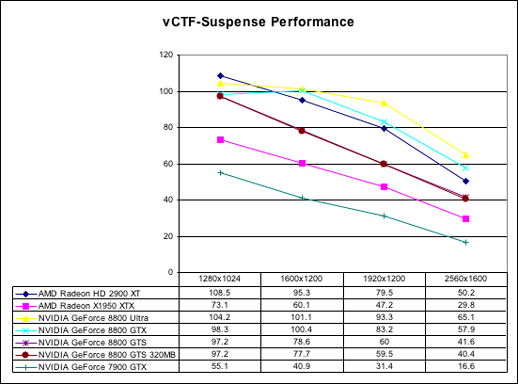
If we look at the scaling graph for Suspense, we can see that the GTS cards remain above 40fps even at 2560x1600. This is quite impressive, especially for the low memory GTS, but we do have to keep in mind that this is a flyby in a demo version of the game and we may see changes in performance between now and the final version.
Also intriguing is the fact that the high end NVIDIA hardware seems to become CPU limited at less than 1600x1200. This leads to the fact that AMD's Radeon HD 2900 XT actually outperforms the 8800 Ultra at 1280x1024. The 8800 Ultra does seem to scale very well with resolution, while the 7900 GTX drops off quickly and under performs through out the test.
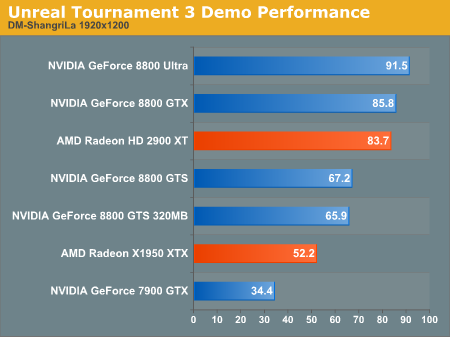
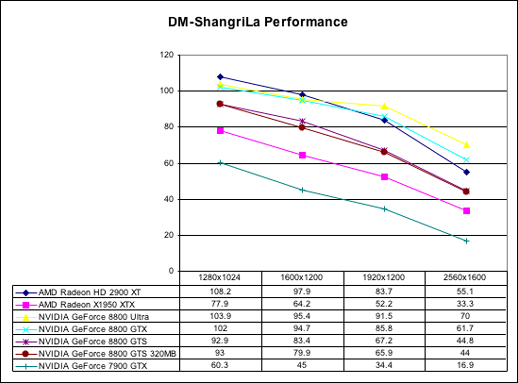
While the rest of this data is very similar to what we've already presented, we did go to the trouble of running the numbers. In order to present a complete picture of what we've seen on the less demanding levels, here is the rest of our data:

Final Words
We're just getting started with our UT3 performance analysis, but already there are some interesting conclusions to be had. Quite possibly the biggest takeaway from this comparison is the dramatic improvement in multi-threaded game development over the past couple of years. Starting from a point where none of our game benchmarks were multi-threaded just two years ago, here we are today with the latest and greatest from Epic, and seeing huge gains from one to two cores, and promising improvements when moving to four cores.
Quad-core gaming is still years away from being relevant (much less a requirement), but the industry has come a tremendous distance in an honestly very short period of time. We're more likely to have multi-threaded games these days than 64-bit versions of those titles, mostly thanks to the multi-core architecture in both the Xbox 360 and PlayStation 3. Like it or not, but much of PC gaming development is being driven by consoles, the numbers are simply higher on that side of the fence (even though the games themselves look better on this side).
On the GPU side, NVIDIA of course does quite well with the 8800 lineup, but the real surprise is how competitive AMD is with the Radeon HD 2900 XT. There may be some salvage yet for that architecture, if AMD could only bring out a midrange part that actually offered compelling performance...


72 Comments
View All Comments
Anand Lal Shimpi - Wednesday, October 17, 2007 - link
Woooooooops, fixed :)Olaf van der Spek - Wednesday, October 17, 2007 - link
So your comment about overclocking a 1 mb cache CPU 20% to get the performance of a 2 mb cache CPU isn't valid.