Intel Core 2 Extreme QX6850 and Massive Price Cuts
by Anand Lal Shimpi on July 16, 2007 3:04 AM EST- Posted in
- CPUs
Gaming Performance
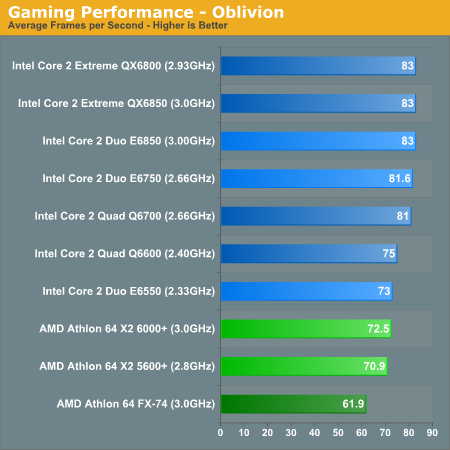
Our first 3D game test is our walkthrough of Bruma in the popular RPG Oblivion. This test was run at 1600 x 1200 with Very High quality defaults selected from Oblivion's launcher. FRAPS was used in this benchmark:
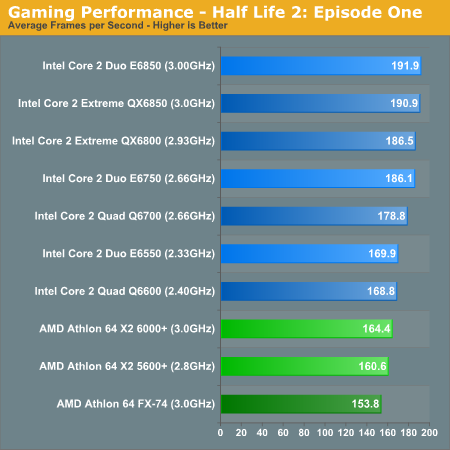
We ran Half Life 2: Episode One at 1600 x 1200, with all settings at their maximum values with the exception of AA/anisotropic filtering, which we left disabled.
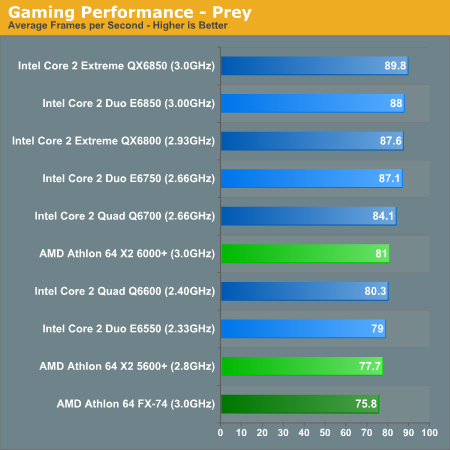
We ran Prey at 1600 x 1200 with High Quality textures, all detail settings were set to their highest options, no AA, and 8X aniso:
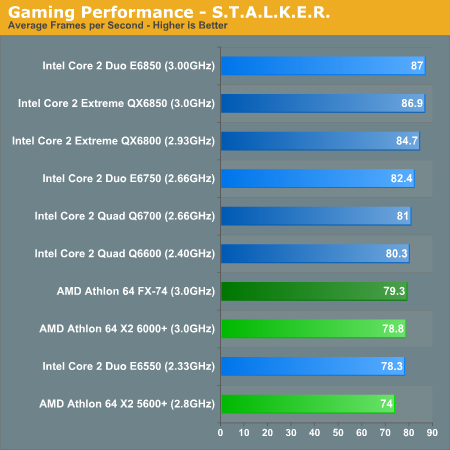
S.T.A.L.K.E.R. was tested at 1024 x 768 with full dynamic lighting enabled and high quality detail settings:
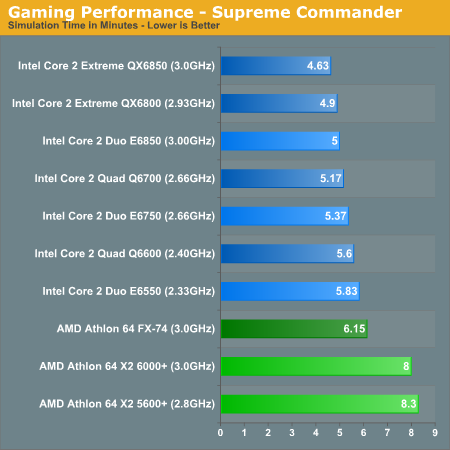
We ran Supreme Commander at 1024 x 768 with medium quality presets. We've changed our Supreme Commander benchmark a bit at the advice of Gas Powered Games' senior engineers. We created a skirmish with 7 AI players and let them duke it out for almost 30 minutes, we saved the replay and then measured the amount of time it took to playback the recording at maximum gamespeed (+10). The figures below are expressed in minutes, lower playback time being better:
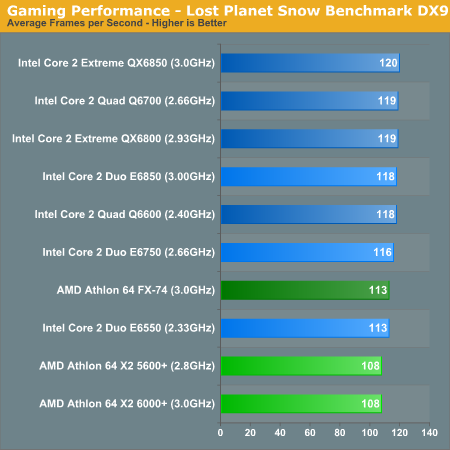
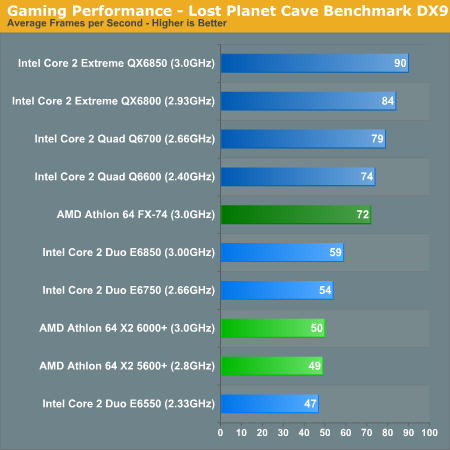
Capcom's Lost Planet demo is available in both DX9 and DX10 flavors, but for this review we used the DX9 version given that we've not been able to find any real benefit to running the DX10 version. We had to run Lost Planet at 800 x 600 with a mixture of high/medium quality settings:


68 Comments
View All Comments
xsilver - Wednesday, July 18, 2007 - link
One question has still yet to be answered:how far does the e6850 overclock vs how far the q6600 overclocks
from previous articles the q6600 doesnt reach much beyond 3ghz unless you have supercooling?
but the e6850?
Slash3 - Monday, July 16, 2007 - link
I know this is a bit after the fact, but would it be possible on the "vs" charts, to plot the negative performance improvements (read: performance loss) in a left-of-center fashion, instead of having both extending to the right of zero, with a negative sign tacked on? It makes it pretty difficult to scan visually. Go from -100 to 0 to +100 in the same X axis, and just increase the granularity a bit to fit things on, in cases where there are significant negative values. The E6850 vs Q6600 is a good example. Negative and positive, all over the place. Just friendly commentary. Excellent writeup, otherwise. :)DerekWilson - Monday, July 16, 2007 - link
as was explored in a previous video artilce, we could simply add 100 to each of these and compare the bars with 100 percent meaning eqivalent performance. negatives would be less than 100 while positives would be greater than 100 ...personally, i don't mind the negaive numbers in a different color paradigm. if the readers would prefer the "centered at 100%" style, we will certainly adapt.
i don't know how the other editors here feel, but marketing guys like to show us graphs around 100% performance of something ... because of that, it just ends up feeling wrong to me. :-)
dev0lution - Monday, July 16, 2007 - link
No red lines? That's a pretty impressive lineup for the prices Intel has. Looks like there might be Q6600 in my future very soon :)tuteja1986 - Monday, July 16, 2007 - link
where is this price cut.. i don't seem em in newegg.webdawg77 - Monday, July 16, 2007 - link
July 22ndDerekWilson - Monday, July 16, 2007 - link
fixed the red lines issueThatguy97 - Thursday, June 18, 2015 - link
back then i stuck to dual core with my e6600 going all the way up to 4ghz ish speeds