The NVIDIA GeForce 7900 GS: A Closer Look
by Josh Venning on September 19, 2006 5:00 AM EST- Posted in
- GPUs
Test Setup
We already had a look at how the 7900 GS performs relative to several other cards currently on the market from both ATI and NVIDIA. Today we will be looking at how well these individual 7900 GSs perform relative to each other, and we've thrown in a couple of other cards from NVIDIA and ATI for reference. From NVIDIA, we included the reference 7800 GT and the 7900 GT, and from ATI, the X1900 GT and the X1800 GTO.
We tested three different games at three different resolutions to give us a general idea of performance. The games we tested were Battlefield 2, Half-Life2:Episode One, and The Elder Scrolls IV: Oblivion. We tested each of these games at 1024x768, 1280x1024, and 1600x1200 with graphics quality settings on high in each game whenever possible.
This is the system we used for testing:
*Note that sound was disabled for testing.
Battlefield 2
We start our performance tests by looking at Battlefield 2, one of our standard game benchmarks. This benchmark is basically a running game demo following several players in different vehicles (including a jet) and on foot in third-person view. This gives us samples from different perspectives in the game and provides a good overview of the performance in Battlefield 2. Detail settings are on "High" for testing.
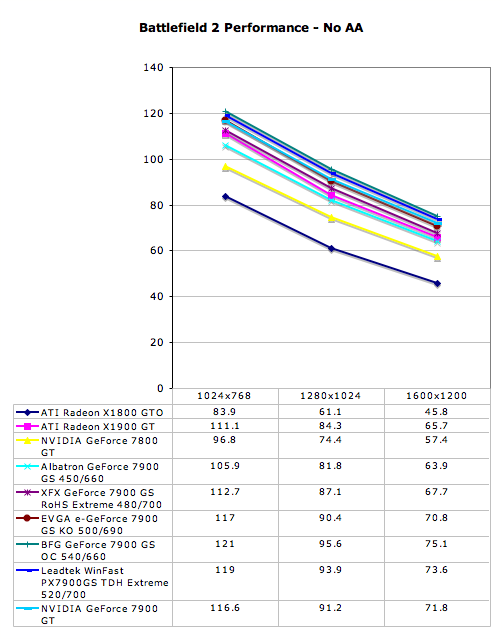
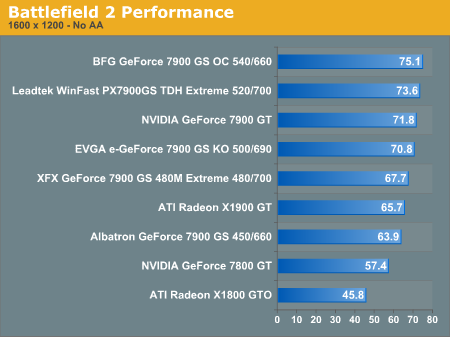
The five 7900 GS samples we have here offer a good representation of the performance potential this card has with different factory overclocks from card manufacturers. The "out of the box" performance of the 7900 GS will vary more or less depending on the game between different card versions. In Battlefield2, we see a significant difference between performance between the slowest 7900 GS (the Albatron GeForce 7900 GS) which is clocked at reference speeds, and the higher clocked BFG GeForce 7900 GS OC. At 1600x1200 resolution, there is a 17.5% framerate increase with the overclocked BFG 7900 GS, which could definitely be a noticeable improvement during gameplay.
Also, we can see how at reference speeds, the 7900 GS gets lower framerates than the reference 7900 GT, but most of our factory overclocked 7900 GS cards match or surpass the performance of the 7900 GT in each resolution. This is important considering that the 7900 GT generally costs around $100 more than the 7900 GS. Keep in mind however, that the 7900 GT has potential for overclocking as well, and its performance potential will exceed that of the 7900 GS depending on the specific card and application.
Something else we see that is particularly noteworthy here and in the other game tests is how ATI's X1900 GT compares to these 7900 GS cards in performance. The 7900 GS at reference speeds doesn't perform as well as the X1900 GT; for example, at 1024x768 the Albatron 7900 GS gets a framerate of 105.9 FPS verses the X1900 GT's 111.1 FPS. But as we saw in the previous example, our Leadtek and BFG 7900 GS samples get higher performance with their factory overclocks, which is of interest given these cards are in direct competition with each other.
We already had a look at how the 7900 GS performs relative to several other cards currently on the market from both ATI and NVIDIA. Today we will be looking at how well these individual 7900 GSs perform relative to each other, and we've thrown in a couple of other cards from NVIDIA and ATI for reference. From NVIDIA, we included the reference 7800 GT and the 7900 GT, and from ATI, the X1900 GT and the X1800 GTO.
We tested three different games at three different resolutions to give us a general idea of performance. The games we tested were Battlefield 2, Half-Life2:Episode One, and The Elder Scrolls IV: Oblivion. We tested each of these games at 1024x768, 1280x1024, and 1600x1200 with graphics quality settings on high in each game whenever possible.
This is the system we used for testing:
| CPU: | Intel Core 2 Extreme X6800 (2.93GHz/4MB) |
| Motherboard: | Intel D975XBX (LGA-775) ASUS P5NSLI |
| Chipset: | Intel 975X NVIDIA nForce 570 SLI |
| Chipset Drivers: | Intel 7.2.2.1007 (Intel) NVIDIA nForce 8.22 |
| Hard Disk: | Seagate 7200.7 160GB SATA |
| Memory: | Corsair XMS2 DDR2-800 4-4-4-12 (1GB x 2) |
| Video Card: | Various |
| Video Drivers: | ATI Catalyst 6.8 NVIDIA ForceWare 91.47 |
| Desktop Resolution: | 1920 x 1440 - 32-bit @ 60Hz |
| OS: | Windows XP Professional SP2 |
*Note that sound was disabled for testing.
Battlefield 2
We start our performance tests by looking at Battlefield 2, one of our standard game benchmarks. This benchmark is basically a running game demo following several players in different vehicles (including a jet) and on foot in third-person view. This gives us samples from different perspectives in the game and provides a good overview of the performance in Battlefield 2. Detail settings are on "High" for testing.
The five 7900 GS samples we have here offer a good representation of the performance potential this card has with different factory overclocks from card manufacturers. The "out of the box" performance of the 7900 GS will vary more or less depending on the game between different card versions. In Battlefield2, we see a significant difference between performance between the slowest 7900 GS (the Albatron GeForce 7900 GS) which is clocked at reference speeds, and the higher clocked BFG GeForce 7900 GS OC. At 1600x1200 resolution, there is a 17.5% framerate increase with the overclocked BFG 7900 GS, which could definitely be a noticeable improvement during gameplay.
Also, we can see how at reference speeds, the 7900 GS gets lower framerates than the reference 7900 GT, but most of our factory overclocked 7900 GS cards match or surpass the performance of the 7900 GT in each resolution. This is important considering that the 7900 GT generally costs around $100 more than the 7900 GS. Keep in mind however, that the 7900 GT has potential for overclocking as well, and its performance potential will exceed that of the 7900 GS depending on the specific card and application.
Something else we see that is particularly noteworthy here and in the other game tests is how ATI's X1900 GT compares to these 7900 GS cards in performance. The 7900 GS at reference speeds doesn't perform as well as the X1900 GT; for example, at 1024x768 the Albatron 7900 GS gets a framerate of 105.9 FPS verses the X1900 GT's 111.1 FPS. But as we saw in the previous example, our Leadtek and BFG 7900 GS samples get higher performance with their factory overclocks, which is of interest given these cards are in direct competition with each other.


42 Comments
View All Comments
sum1 - Wednesday, September 20, 2006 - link
Let me clarify:
"The BFG 7900 GS OC's core clock is set at 520MHz, a 70MHz increase over the standard NVIDIA 7900 GS"
It’s listed at 540MHz everywhere else in this article (including the benchmarks).
DerekWilson - Tuesday, September 19, 2006 - link
For some reason, BFG's website lists it as 525MHz. We'll double check our sample, but we listed the speed of the card we reviewed.http://www.bfgtech.com/7900GS_256_PCIX.html">http://www.bfgtech.com/7900GS_256_PCIX.html
EVGA is actually EVGA despite the fact that people tend to lowercase the leading 'e'. Check their own press releases on their site.
http://www.evga.com/about/pressrelease/default.asp...">http://www.evga.com/about/pressrelease/...t.asp?re...
Maybe uniqueness can come in shades of blue if it can't be grey :-) I see your point, but sometimes taking a little liberty with language gives us the ability to succinctly convey something like the idea that "this is mostly the same as everything else with a slight difference in one area".
yacoub - Tuesday, September 19, 2006 - link
I really don't like the line graphs... very hard to read when more than three or four lines are close together. Get much more meaningful data much more quickly from traditional bar graphs or a simple table with numbers.DerekWilson - Tuesday, September 19, 2006 - link
the line graphs include a table -- just ignore the top part :-)the problem with bar graphs are that they don't clearly show trends between cards over different resolutions, they don't show the impact of increasing resolution for each card, and they take up qutie a bit more space.
we'd love to hear more good suggestions on ways we can better present our data though.
Questar - Tuesday, September 19, 2006 - link
Stacked bars do.
DerekWilson - Tuesday, September 19, 2006 - link
i think those are harder to read than line graphs.VooDooAddict - Tuesday, September 19, 2006 - link
I agree that they are harder to read. Persoanlly I like the way they show how the cards scale. Unfortunetly while it's nice to have all the data right there. I used to be able to show non-techie friends a page or two from your review to pointout the performance advantages of one video chipset over the other.With the new line graphs and data grids I need to make my own simple bar graphs from your data to show friends info relivant to thier purchase decision. (I would never re-publish these graphs with your data... just used to give non-techie friends better direction.)
As a side note. I personally know quite a few people out there debating over the current $100-$240 range: The new X1300 XT (Which is baqsicly a X1600 Pro), X1600 XT, 7600GS, 7600GT, X1900GT, 7900GS, 7900GT (with rebates) ... you might want to take note of these if you ever toss up more Low-Midrange buying guides.
yacoub - Tuesday, September 19, 2006 - link
"The EVGA 7900 GS's heat sink is slightly longer than the reference 7900 GS's heat sink and it has two gill-shaped cutouts exposing some copper ridges from the inside of the sink. Aside from that, the card has the signature EVGA black coloring, with their logo and card name in clear view on the face."You could also mention that it covers the RAM chips. That's kind of the point of its design and something nice to have.
Kougar - Tuesday, September 19, 2006 - link
Finally happy to see that eVGA only cooler get tested, looks like they knew what they were doing desiging it and using it on many of their G70 cards...Should also note the eVGA has had a $20 MIR on it for over a week, ties it with the XFX for best priced... but the warranty, non-stock cooler, and HDCP support ought to make it an obvious choice between the two.
mostlyprudent - Tuesday, September 19, 2006 - link
XFX makes a passively cooled 7950GT, but puts a fan on their 7900GS? Maybe it's a price issue (more expensive to passively cool a card and less profit margin at the $200 price range)?