Intel's Core 2 Extreme & Core 2 Duo: The Empire Strikes Back
by Anand Lal Shimpi on July 14, 2006 12:00 AM EST- Posted in
- CPUs
3D Rendering Performance using 3dsmax 7 & CineBench 9.5
We're looking at 3D rendering performance using two different applications: 3D Studio Max and Cinebench 9.5. Cinebench is a free performance testing utility based off of the CINEMA 4D R8 rendering package. Our scores from 3D Studio Max are a composite score from four rendering tests: CBalls2, SinglePipe2, UnderWater, and 3dsmax5 Rays.
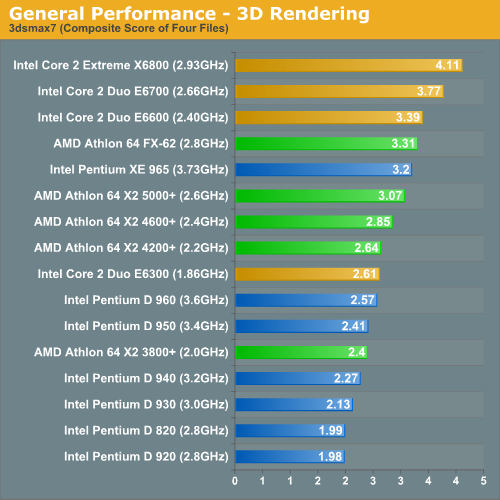
The Core 2 Extreme leads by 24% in the 3D Studio Max composite score, with performance leads in the individual tests ranging from 20% to 31%. At the lower end of the performance spectrum, the E6300 averages a 9% lead over the X2 3800+ and performs about equal to the 4200+. The margin of victory over the 3800+ ranges from 7% to 12% in the individual results.
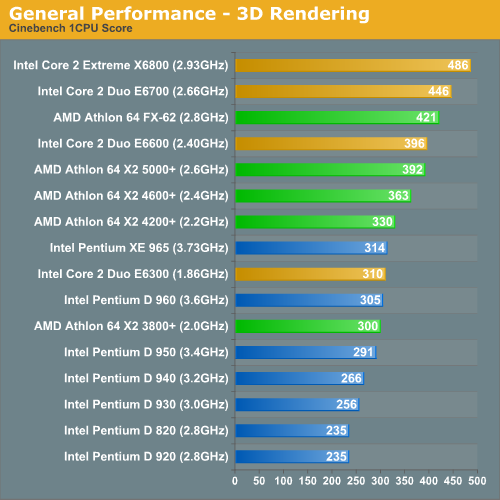
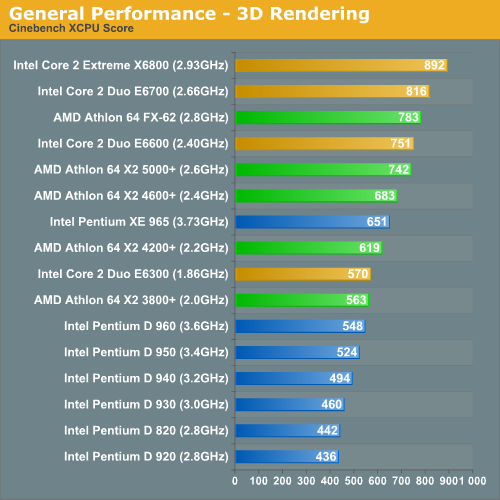
Moving on to Cinebench, Core 2 Extreme takes the performance crown again, but with a closer margin of victory than in 3dsmax: 14%-15% in SMP and single CPU modes. The Core 2 Duo E6300 barely comes out ahead of the X2 3800+, but the 1%-3% lead is basically a tie.


202 Comments
View All Comments
Anand Lal Shimpi - Friday, July 14, 2006 - link
Corrected, it was a misprint.Take care,
Anand
Zorba - Friday, July 14, 2006 - link
Why is the article talking about how Intel is killing AMD on power consumption when AMD is on the top for both idle and load? If you are doing a performance/watt ratio you need to show that on the graph. This page (page 7) just makes the how article look completely baised.Calin - Friday, July 14, 2006 - link
Because the EE SFF processors were hard to obtain by Anandtech even for testing purposes. I'm not sure they are available in retail market any more than Conroe isAnand Lal Shimpi - Friday, July 14, 2006 - link
The Core 2 Extreme X6800 has a performance per watt score of 0.3575 in WME9 compared to 0.2757 for the X2 3800+ EE SFF. I'll put together a performance per watt graph now and see if I can stick it in there.Take care,
Anand
Anand Lal Shimpi - Friday, July 14, 2006 - link
I included the performance per watt scores I mentioned above in the review now, hopefully that will make things a little more clear.Take care,
Anand
JarredWalton - Friday, July 14, 2006 - link
I don't see the chart, Anand - I hope I didn't accidentally overwrite your change. Sorry!MrKaz - Friday, July 14, 2006 - link
Don't put it because it's a biased chart,Why based on WM9 benchmark? Why not one of the others?
Why put it now, if you never put it when A64 was killing the P4s?
coldpower27 - Friday, July 14, 2006 - link
Because AMD didn't real make a big deal about the performance per watt intiative back in the day. They focused on their price/performance instead.MrKaz - Friday, July 14, 2006 - link
So?Just because Intel focuses now on that Anandtech must be obliged to put it?
So for you where was the price/performance (A64 vs P4) charts on Anandtech reviews?
coldpower27 - Friday, July 14, 2006 - link
Yeah, due to their making people aware of it, it has now become a issue.It was only after Prescott, that we became more aware that thermals were starting to get out of control and paid more attention to wattage numbers.
Price/Performance is not as hard to calculate.