NVIDIA's Tiny 90nm G71 and G73: GeForce 7900 and 7600 Debut
by Derek Wilson on March 9, 2006 10:00 AM EST- Posted in
- GPUs
The Test and Power
For our test setup, we are using two different 2x x16 ASUS boards: one based on NVIDIA and the other ATI core logic. For all tests with NVIDIA GPUs we used the NVIDIA motherboard, and for all tests with ATI GPUs we employed the ATI based motherboard. All power tests were performed using the same motherboard (the RD580 board).
In an attempt to keep everything readable and manageable, we have split up the high end and mid range comparisons. Our high end parts will be compared at 1280x1024, 1600x1200, 1920x1440, and 2048x1536. The mid range comparison will look at 1024x768, 1280x1024, and 1600x1200. All SLI and CrossFire tests will be included with the high end data.
Test Setup:
ASUS A8N32 NVIDIA nForce 4 X16 SLI Motherboard
ASUS A8R32 ATI RD580 Motherboard
AMD Athlon 64 FX-57
2GB OCZ 2.5:3:3:8 DDR400 RAM
160GB Seagate 7200.7 Hard Drive
600W OCZ PowerStream PSU
Drivers:
NVIDIA ForceWare 84.17 (Beta)
ATI Catalyst 6.2
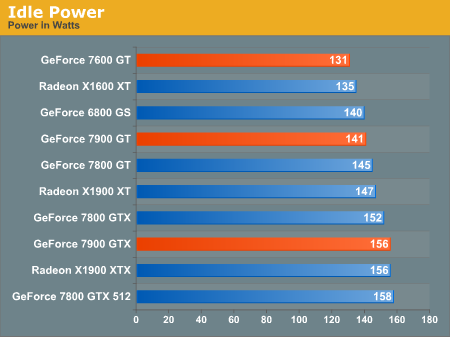
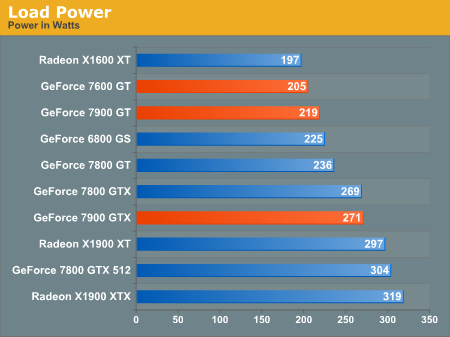
For power consumption, we once again take a look at the power draw of the system at the wall using our trusty Kill-A-Watt. Power load was measured while running the 3dmark06 feature tests as they tend to provide something near a worst case power load. What we see in games is usually a handful of watts lower than this. For idle power, we don't see that much difference between the high end cards, and the 7900 GT is similar in power to the 6800 GS. The 7600 GT seems to be on par with the X1600 XT for idle power.
When it comes to load, the new NVIDIA parts simply clean up. The performance per watt leader in this contest is hands down NVIDIA. The 7600 GT and 7900 GT both come in at a lower power than the 6800 GS and the 7900 GTX pulls the same wattage as the much lower clocked 7800 GTX.
For our test setup, we are using two different 2x x16 ASUS boards: one based on NVIDIA and the other ATI core logic. For all tests with NVIDIA GPUs we used the NVIDIA motherboard, and for all tests with ATI GPUs we employed the ATI based motherboard. All power tests were performed using the same motherboard (the RD580 board).
In an attempt to keep everything readable and manageable, we have split up the high end and mid range comparisons. Our high end parts will be compared at 1280x1024, 1600x1200, 1920x1440, and 2048x1536. The mid range comparison will look at 1024x768, 1280x1024, and 1600x1200. All SLI and CrossFire tests will be included with the high end data.
Test Setup:
ASUS A8N32 NVIDIA nForce 4 X16 SLI Motherboard
ASUS A8R32 ATI RD580 Motherboard
AMD Athlon 64 FX-57
2GB OCZ 2.5:3:3:8 DDR400 RAM
160GB Seagate 7200.7 Hard Drive
600W OCZ PowerStream PSU
Drivers:
NVIDIA ForceWare 84.17 (Beta)
ATI Catalyst 6.2
For power consumption, we once again take a look at the power draw of the system at the wall using our trusty Kill-A-Watt. Power load was measured while running the 3dmark06 feature tests as they tend to provide something near a worst case power load. What we see in games is usually a handful of watts lower than this. For idle power, we don't see that much difference between the high end cards, and the 7900 GT is similar in power to the 6800 GS. The 7600 GT seems to be on par with the X1600 XT for idle power.
When it comes to load, the new NVIDIA parts simply clean up. The performance per watt leader in this contest is hands down NVIDIA. The 7600 GT and 7900 GT both come in at a lower power than the 6800 GS and the 7900 GTX pulls the same wattage as the much lower clocked 7800 GTX.


97 Comments
View All Comments
redlotus - Thursday, March 9, 2006 - link
Where the heck is the X3: Reunion rolling demo benchmark? I was all geeked when AT reviewed it and said "it will make a fine addition to our round of benchmarks." Well then when the heck are you going to start using it? I have yet to see it being used for any of the articles posted since the review.DerekWilson - Thursday, March 9, 2006 - link
We really will be including X3 in our benchmarks ^_^;;The benchmark does take quite a long time and we needed to optimize our performance testing in order to make sure we could get the article up for the launch.
As I have mentioned, we will be doing a follow up article, and I will look into including the X3 demo.
Thanks,
Derek Wilson
5150Joker - Thursday, March 9, 2006 - link
Check out these discrepancies with Anandtech's review, boy has this site been going downhill lately:From your older review:
http://images.anandtech.com/graphs/ati%20radeon%20...">http://images.anandtech.com/graphs/ati%...0x1900%2...
Then today's review:
http://images.anandtech.com/graphs/7900%20and%2076...">http://images.anandtech.com/graphs/7900...%207600%...
How did the XTX Crossfire lose 11 FPS with a very mild bump in resolution? Worst yet, their editors didn't even mention which drivers they used for their review.
Cygni - Friday, March 10, 2006 - link
Wow, its like numbers change with different motherboards, chipsets, and driver revisions. ALRET THE PRESS!
Spinne - Thursday, March 9, 2006 - link
That is really odd. I'd expect the numbers to swing a little, but 11 fps is 25% of 44fps. Could they be using different benchmarks? Atleast they aren't simply using the numbers from the X1900 review and are actually retesting stuff.DerekWilson - Thursday, March 9, 2006 - link
We retested with an updated motherboard (RD580) and an updated driver (CAT 6.2).We used the same test for F.E.A.R. (the built in performance test).
I'm not sure why performance would drop in this case.
DerekWilson - Thursday, March 9, 2006 - link
I've been looking into this, and we also are now using F.E.A.R. 1.03 rather than 1.02 which we used last time.I retested the x1900 xtx crossfire and got the same results. I'm really not sure what happened with this, but I'll keep poking around.
munky - Thursday, March 9, 2006 - link
FEAR is one game where the x1900's have had a big lead over the 7800's, and your results from today just done make sense. How does a x1900xtx get 59fps at 1280x1024, when the gtx512 also get 59 and the 7900gtx ges 63? Comapare it to the results from another site - http://www.techreport.com/reviews/2006q1/geforce-7...">http://www.techreport.com/reviews/2006q1/geforce-7.... At 1280x960 they place the xtx at 57fps, the 7900gtx at 46, and the gtx512 at 44, which are more inline with the results I have seen before.DigitalFreak - Thursday, March 9, 2006 - link
There is a known bug in the current drivers that causes a performance drop with the 7900GTX in FEAR. Check our HardOCP's preview, where they use the updated driver from Nvidia. FEAR scores are the same or higher than the 1900XT(x)DerekWilson - Thursday, March 9, 2006 - link
We went back and updated our performance numbers with the afore mentioned driver fix.NVIDIA released it to the press late in the weekend, but we felt the performance increase was important enough to retest with the new driver.
I haven't read Scott's article at the Tech Report yet, so I don't know what driver he used.