Intel's Pentium Extreme Edition 955: 65nm, 4 threads and 376M transistors
by Anand Lal Shimpi on December 30, 2005 11:36 AM EST- Posted in
- CPUs
Media Encoding Performance using DVD Shrink, WME9, Quicktime and iTunes
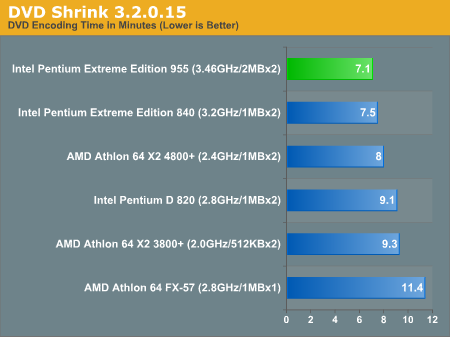
First up is DVD Shrink 3.2.0.15. Our test was simple - we took a copy of Star Wars Episode VI and ripped the full DVD to the hard drive without compression, effectively giving us an exact copy of the disc on the hard drive. Then, using the copy of the DVD on the hard drive (to eliminate any DVD drive bottlenecks), we performed a DVD shrink operation to shrink the movie to fit on a single 4.5GB DVD disc. All of the options were left on their defaults, so the test ends up being pretty easy to run and reproduce. The scores reported are DVD encoding times in minutes, with lower numbers meaning better performance.
The DVD Shrink test is quite important as DVD Shrink is quite possibly one of the easiest tools to rip a DVD. The easier a tool is to use, the more likely it's going to be used, and arguably, the more important performance using it happens to be.
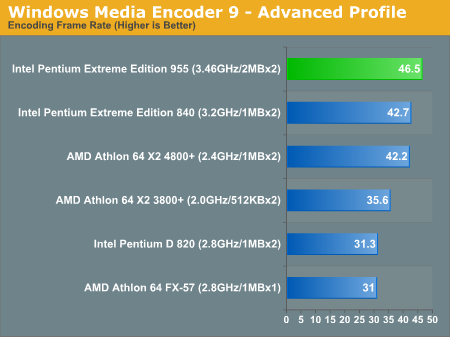
Moving on, we have our Windows Media Encoder 9 test, which uses the advanced profile settings for video encoding. We left all settings at their defaults and just proceeded with an MPEG-2 to WMV-HD conversion. The values reported are in frames per second, with higher numbers being better.
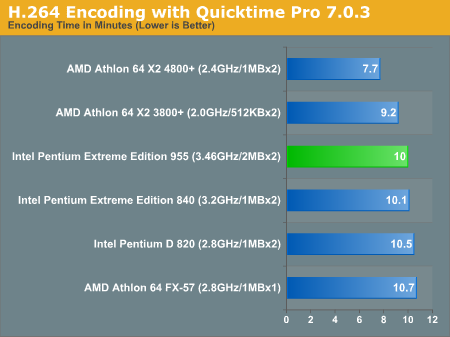
Next up, we have Quicktime Pro 7.0.3 and we perform a MPEG-2 to H.264 encoding task. All of the settings are left at their defaults, with the exception that we optimize the output file for download with a 256kbps data rate while leaving the resolution untouched. We also adjust the video options to optimize for the best quality. We report the transcoding time in minutes, with lower values being better.
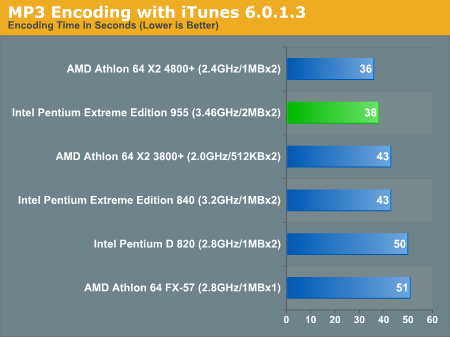
Finally, we have a MP3 encoding test using iTunes 6.0.1.3. For this test, we simply took a 304MB wav file and converted it to a 192kbps MP3 file, measuring the encode time in seconds. The only iTunes option that we changed was to prevent the playback of the song while encoding.
First up is DVD Shrink 3.2.0.15. Our test was simple - we took a copy of Star Wars Episode VI and ripped the full DVD to the hard drive without compression, effectively giving us an exact copy of the disc on the hard drive. Then, using the copy of the DVD on the hard drive (to eliminate any DVD drive bottlenecks), we performed a DVD shrink operation to shrink the movie to fit on a single 4.5GB DVD disc. All of the options were left on their defaults, so the test ends up being pretty easy to run and reproduce. The scores reported are DVD encoding times in minutes, with lower numbers meaning better performance.
The DVD Shrink test is quite important as DVD Shrink is quite possibly one of the easiest tools to rip a DVD. The easier a tool is to use, the more likely it's going to be used, and arguably, the more important performance using it happens to be.
Moving on, we have our Windows Media Encoder 9 test, which uses the advanced profile settings for video encoding. We left all settings at their defaults and just proceeded with an MPEG-2 to WMV-HD conversion. The values reported are in frames per second, with higher numbers being better.
Next up, we have Quicktime Pro 7.0.3 and we perform a MPEG-2 to H.264 encoding task. All of the settings are left at their defaults, with the exception that we optimize the output file for download with a 256kbps data rate while leaving the resolution untouched. We also adjust the video options to optimize for the best quality. We report the transcoding time in minutes, with lower values being better.
Finally, we have a MP3 encoding test using iTunes 6.0.1.3. For this test, we simply took a 304MB wav file and converted it to a 192kbps MP3 file, measuring the encode time in seconds. The only iTunes option that we changed was to prevent the playback of the song while encoding.


84 Comments
View All Comments
Betwon - Saturday, December 31, 2005 - link
NO, 2. is wrong.We need to know the end time of all tasks.
The sum of each task's time will mislead.
Because it can not show the real time spend to complete those tasks. (Time is overlayed)
Viditor - Saturday, December 31, 2005 - link
That's what I thought you meant...it's not misleading to me (nor to most of the other readers I gather, since nobody else has come forward). If you want to know the time to complete all tasks, then just take the largest time number of what ever test you wish.
The reason that the setup they used appeals to me is that it helps me understand how an individual application is affected under those conditions, and the totals give me a relative picture of each of the apps as a whole. They haven't said that the time listed in the "Total" is actually how long things took in reality, they said it was the total of the times.
I understand that the difference in those two phrases is perhaps a difficulty that many have when understanding a foriegn language...
In the future, you might want to be less confrontational about your questions...
Phrases like "There are still many knowledge about CPU that anandtech need to learn" are considered quite inhospitable...
fitten - Saturday, December 31, 2005 - link
No. What is being mentioned here is "Wall Clock Time" vs. summation of execution times. You start a stopwatch at the instant you start your task bundle and when the last task in the bundle is finished, you stop your stopwatch. That's the wall clock time. Measuring CPU utilization time is quite easily seen to be false. with two CPUs, two tasks may take 20s each to finish, but they may start and finish at the same time after 20s of wall clock time... not 20s + 20s = 40s (each task will see 20s of CPU utilization time, but those sets of 20s are simultaneously used... 20s on one CPU and 20s on the other CPU at the same time - for a wall clock finish time of 20s, not 40s).And, you cannot simply take the largest time number. For example, suppose a task that runs for 1s is blocked by a second task which takes 10s, then the first task takes another 1s to finish, while 10s is larger than 2s, the wall clock time for this bundle is actually 12s (1s + 10s + 1s), not 10s or 2s.
bldckstark - Monday, January 2, 2006 - link
Ummmmm, all of the times you are screaming about are listed. You can work it out for yourself. Although, when you look at the concurrent timing for each app, you will find that the AMD posted a better score. Concurrent timing results -AMD 4800+ - 65.9s
955EE No HT - 83.3
955EE With HT - 71.1
Consecutive times of course show a different picture, and most of all, SPCC is a wreck during all of this for AMD.
I have to say, I can't remember when I last opened 4 huge memory and CPU hogging programs at exactly the same time that I tried to play a game. These CPU's may be great at doing this many activities at once, but I can only do one thing at a time. Each of these programs would be started separately, and when they are on their way, I might start gaming. This is a great test, but not realistic.
Betwon - Friday, December 30, 2005 - link
Your test of the SMP game --Quake4Your result is diffirent with the result of the more detail test from FiringSquad.
http://www.firingsquad.com/hardware/quake_4_dual-c...">http://www.firingsquad.com/hardware/qua...-core_pe...
We find that both HT and multi-core will improve the fps. P4 540 HT is about 1x % improvement.
We need your explains. Why you say that HT will not help the in the the SMP game --Quake4?
And we do not find that AthlonX2 have the more excellent improvement than PD, when they work (change from single-core-work to multi-core-work).
Where is the benefits of on-die communication? 101ns latency? why is it slower the lateny of the memory? Is your cache2cache test software wrong?
The test shows that
SMPon/SMPoff PD840 102.9 fps/74.8 fps --> 37.6% improvement
SMPon/SMPoff X2 3800+ 101.1 fps/74.4 fps --> 35.9% improvement
SMPon/SMPoff X2 4800+ 103.2 fps/87.7 fps --> 17.7% improvement
AMD test:
http://www.firingsquad.com/hardware/quake_4_dual-c...">http://www.firingsquad.com/hardware/qua...al-core_...
Intel test:
http://www.firingsquad.com/hardware/quake_4_dual-c...">http://www.firingsquad.com/hardware/qua...-core_pe...
The improvement ratio of PD is better than that of athlonX2.
psychobriggsy - Saturday, December 31, 2005 - link
> SMPon/SMPoff PD840 102.9 fps/74.8 fps --> 37.6% improvement> SMPon/SMPoff X2 3800+ 101.1 fps/74.4 fps --> 35.9% improvement
> SMPon/SMPoff X2 4800+ 103.2 fps/87.7 fps --> 17.7% improvement
Looks like the issue is an upper performance limit around the 103 fps mark that probably isn't caused by the CPU - e.g., GPU or something else.
If it is a memory bandwidth issue (which should be easy to test for by using faster memory and running the tests again) then there isn't much that can be done. Then again, the Intel processor uses DDR2 so ...
If the 4800+ improved by 36% like the 3800+ then it would achieve around 120fps.
In the end it just shows that the lower-priced dual-cores are still a better deal ... especially as they can be overclocked quite nicely.
Viditor - Friday, December 30, 2005 - link
I would hope so, since the patch was partially written by Intel...
http://firingsquad.com/hardware/quake_4_dual-core_...">http://firingsquad.com/hardware/quake_4_dual-core_...
Betwon - Saturday, December 31, 2005 - link
PD840 139.1fps/83fps --> 67.6%PD840 are 67.6 percent faster at 800x600 with threading enabled.
67.6% > 63%
Patch was partially written by Intel...?
But the patch is very excellent!
This patch is the most improvement game patch for SMP CPU.
We can not find that another SMP game patch can improvement the game performent so much.
Good quality of the codes!
Viditor - Saturday, December 31, 2005 - link
Possibly, but Intel is well known for creating an imbalance in performance for their processors using software (e.g. the Intel Compiler). Most likely, future versions of the patch will correct for this. Either way, it really says less about the CPU than it does the patch...