ASRock Industrial 4X4 BOX-7735U UCFF PC Review: Zen 3+, RDNA2, and USB4 in a Potent Platform
by Ganesh T S on April 6, 2023 10:30 AM EST- Posted in
- Systems
- AMD
- UCFF
- USB4
- ASRock Industrial
- Rembrandt
- Ryzen 7000 Mobile
GPU Performance: Synthetic Benchmarks
AMD's Rembrandt-R includes an integrated GPU update to enable it to compete against Intel's Xe iGPUs. The new RDNA2 microarchitecture is present in the Ryzen 7 7735U in the form of the Radeon 680M. With 12 CUs and 768 shader units clocked at 2.2 GHz, AMD claims that the GPU should be capable of playing virtually any modern game at Full HD resolutions. For full-blown desktop systems or mini-PCs targeting the gaming market, we look at gaming workloads. However, for UCFF models like the 4X4 BOX-7735U, we restrict ourselves to a series of canned benchmarks from Kishonti and Futuremark / UL. Prior to that, a look at the capabilities of the GPU via GPU-Z is warranted.
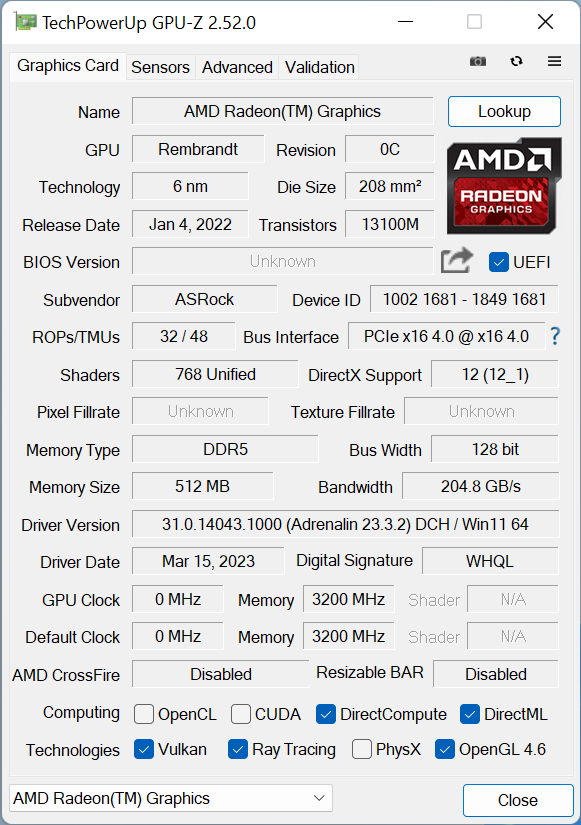
While AMD's product page for the Ryzen 7 7735U provides more clarity on the GPU's clocks, the above screenshot brings out the presence of ray tracing capabilities - a first for an integrated GPU.
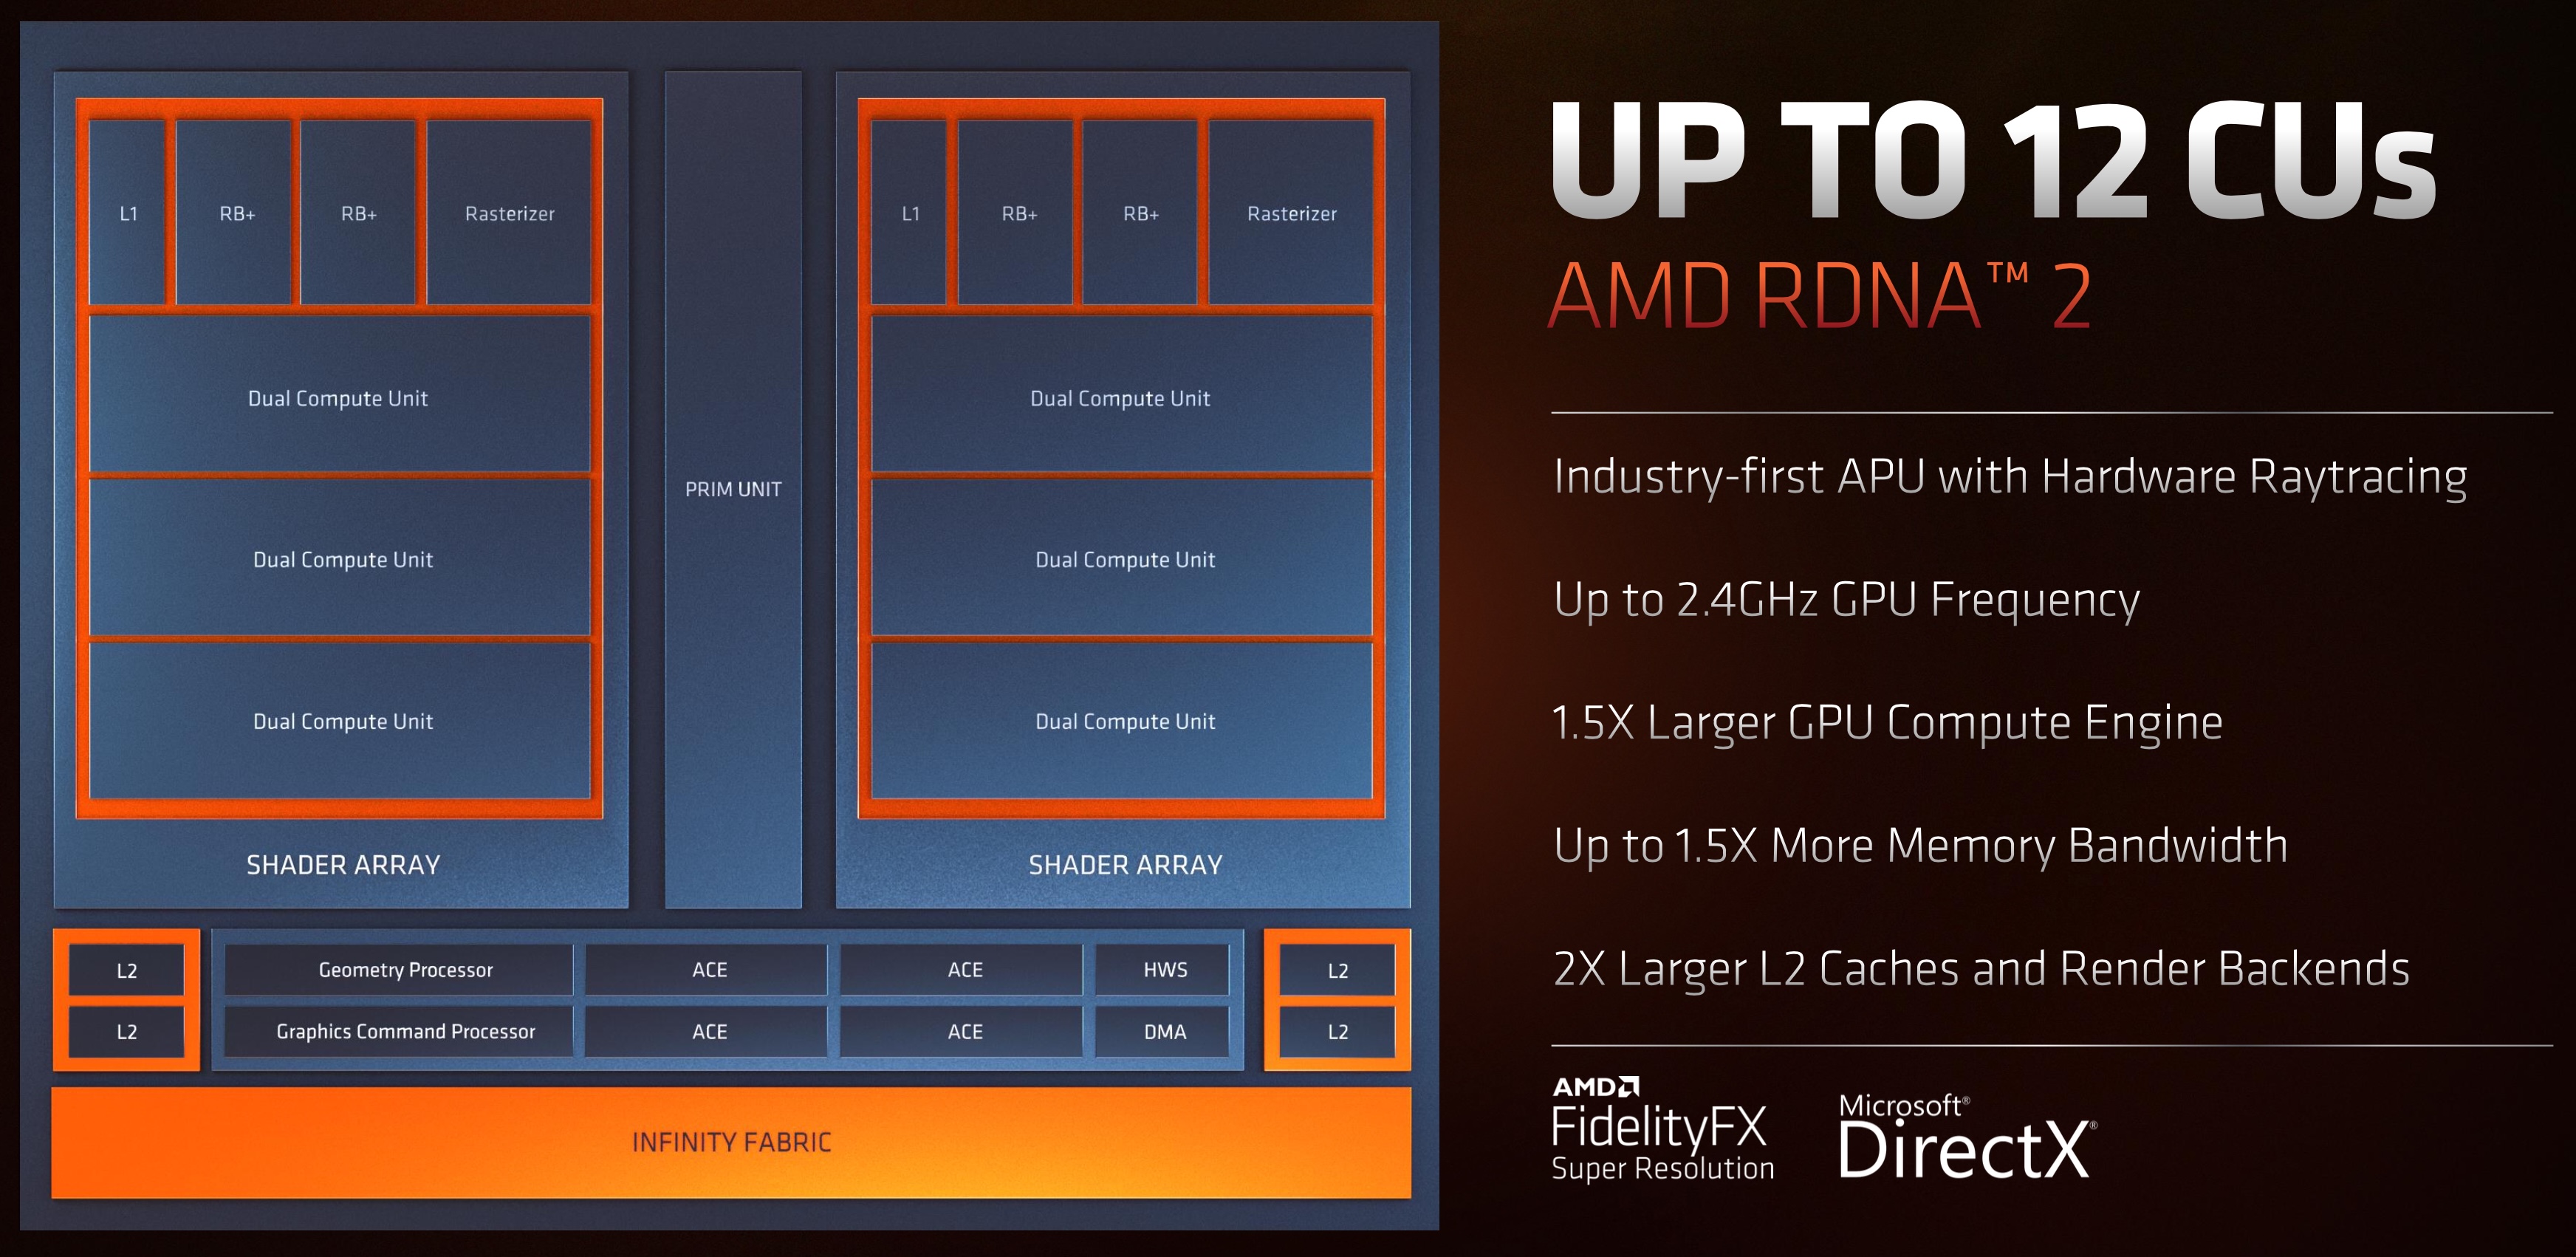
AMD Radeon 680M Features
In the ray tracing department, Rembrandt-R already scores over Intel's latest iGPU. The remaining subsections below look into the performance aspects.
GFXBench
The DirectX 12-based GFXBench tests from Kishonti are cross-platform, and available all the way down to smartphones. As such, they are not very taxing for discrete GPUs and modern integrated GPUs. We processed the offscreen versions of the 'Aztec Ruins' benchmark.
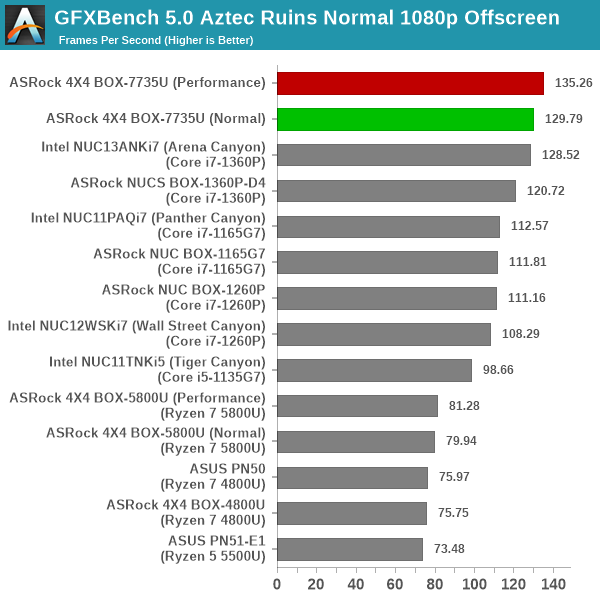
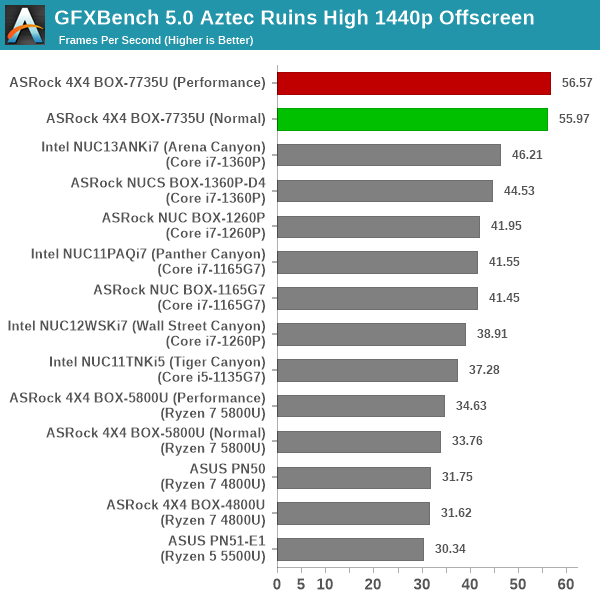
The Radeon 680M has a significant edge over the iGPU in ADL-P / RPL-P, particularly at higher resolutions.
UL 3DMark
Four different workload sets were processed in 3DMark on almost all of the systems in the comparison list - Fire Strike, Time Spy, Night Raid, and Wild Life. Port Royal was also processed on the 4X4 BOX-7735U/D5 alone.
3DMark Fire Strike
The Fire Strike benchmark has three workloads. The base version is meant for high-performance gaming PCs. It uses DirectX 11 (feature level 11) to render frames at 1920 x 1080. The Extreme version targets 1440p gaming requirements, while the Ultra version targets 4K gaming system, and renders at 3840 x 2160.
| UL 3DMark - Fire Strike Workloads | |||
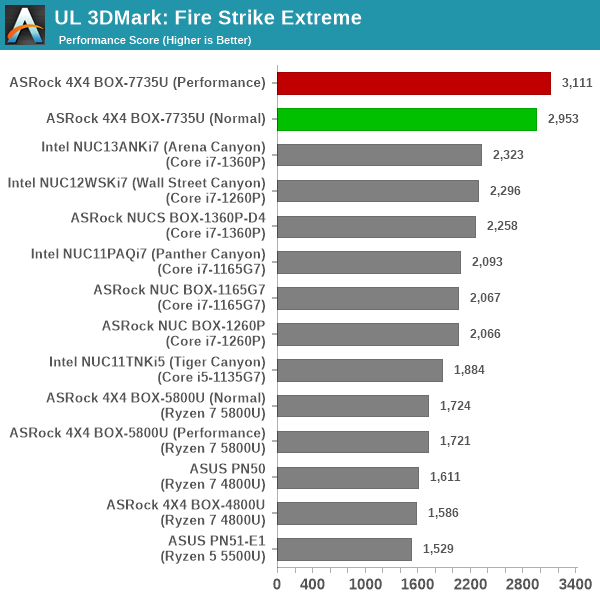
The graph above presents the overall score for the Fire Strike Extreme and Fire Strike Ultra benchmark across all the systems that are being compared. In both versions, the Radeon 680M outperforms the rest of the pack by a significant margin.
3DMark Time Spy
The Time Spy workload has two levels with different complexities. Both use DirectX 12 (feature level 11). However, the plain version targets high-performance gaming PCs with a 2560 x 1440 render resolution, while the Extreme version renders at 3840 x 2160 resolution. The graphs below present both numbers for all the systems that are being compared in this review.
| UL 3DMark - Time Spy Workloads | |||
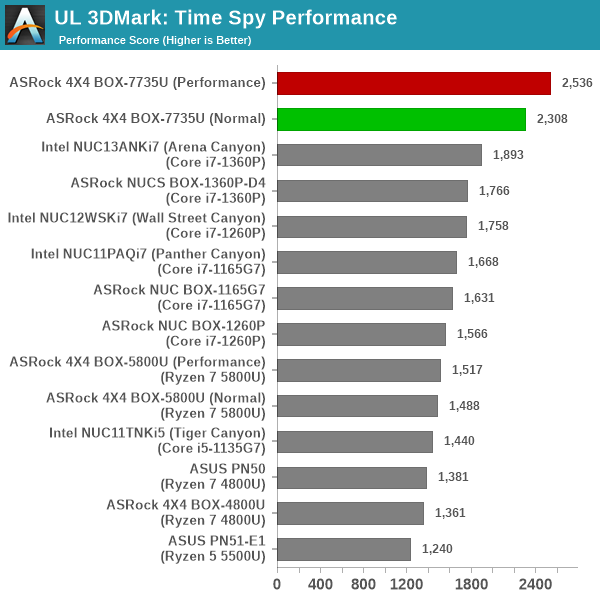
The performance advantage of the Radeon 680M is again eveident in this workload.
3DMark Wild Life
The Wild Life workload was initially introduced as a cross-platform GPU benchmark in 2020. It renders at a 2560 x 1440 resolution using Vulkan 1.1 APIs on Windows. It is a relatively short-running test, reflective of mobile GPU usage. In mid-2021, UL released the Wild Life Extreme workload that was a more demanding version that renders at 3840 x 2160 and runs for a much longer duration reflective of typical desktop gaming usage.
| UL 3DMark - Wild Life Workloads | |||
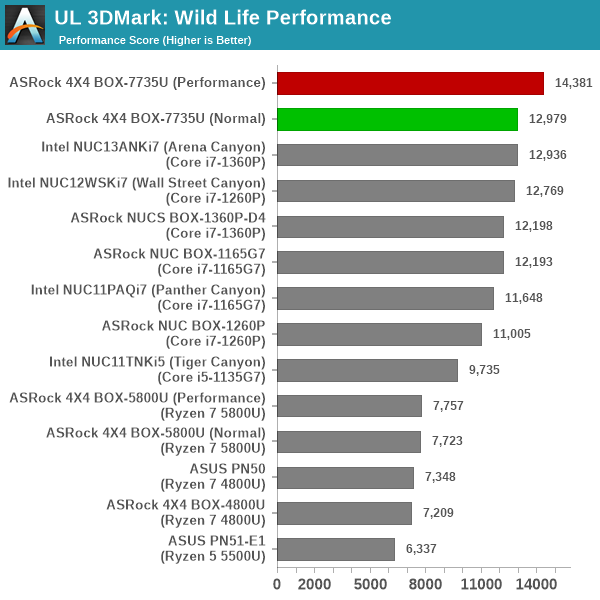
This workload appears to be sensitive to the available power budget. But, even at 28W, the Radeon 680M in the 4X4 BOX-7735U/D5 is able to surpass the 40W Arena Canyon NUC.
3DMark Night Raid
The Night Raid workload is a DirectX 12 benchmark test. It is less demanding than Time Spy, and is optimized for integrated graphics. The graph below presents the overall score in this workload for different system configurations.
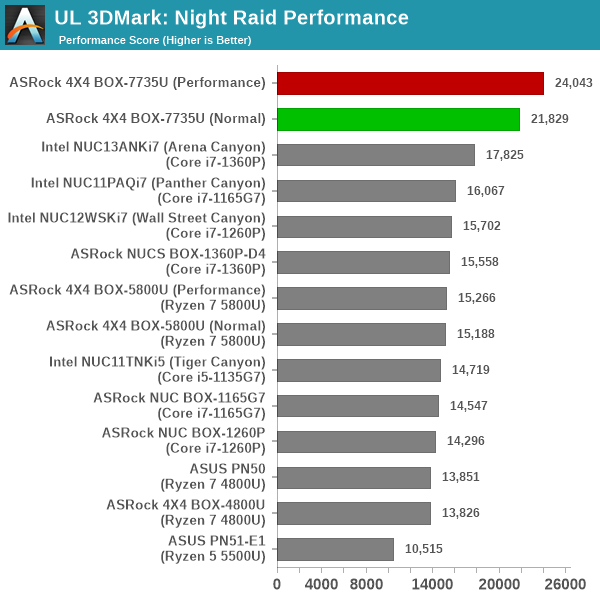
As expected, this is a cakewalk for the RDNA2-based Radeon 680M.
3DMark Port Royal
UL introduced the Port Royal ray-tracing benchmark as a DLC for 3DMark in early 2019. The scores serve as an indicator of how the system handles ray-tracing effects in real-time.
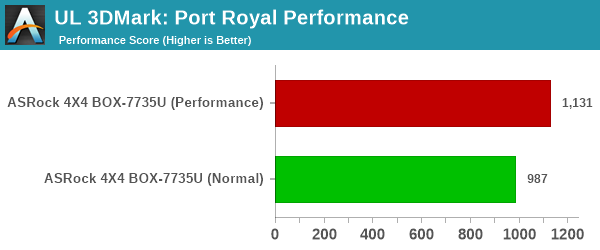
With no other system capable of handling this workload, this is a lonely comparison that only shows that an increase in the power budget can deliver better performance.


35 Comments
View All Comments
sjkpublic@gmail.com - Thursday, April 20, 2023 - link
Interesting. The 5800U GPU is almost twice as slow as this model.sjkpublic@gmail.com - Wednesday, April 12, 2023 - link
Audio. This uses the ALC233 audio chip. Other companies use something else. How does the ALC233 compare to the ALC269?ottonis - Friday, April 21, 2023 - link
"The company could have delivered support for similar TDP values with a better noise profile by allowing for fine-grained fan speed control based on SoC temperature."While this is certainly true (in theory), it might have been difficult for ASRock to properly implement such a feature because the SoC has may have been designed to operate at 28W/35W and not twice as much. In order to allow fan speeds to run lower than 100% would probably have demanded a much beefier cooling solution to begin with, which was probably not possible considering the constraints of the form factor and the price bracket.
sjkpublic@gmail.com - Saturday, April 22, 2023 - link
Agree. Or provide better cooling. Still, I would buy this but it came out too late for me. And yes, 7735HS boxes run at 15W idle and when they spin up the fan noise is less. Still I would go with ASROCK for a 7735 series if I was looking now.sjkpublic@gmail.com - Saturday, May 20, 2023 - link
The 7735 SOC on a mini PC is a great place to be. Only issue I have is memory limitation of 64GB. But that has to do with the SODIMM specs...