ASRock Industrial 4X4 BOX-7735U UCFF PC Review: Zen 3+, RDNA2, and USB4 in a Potent Platform
by Ganesh T S on April 6, 2023 10:30 AM EST- Posted in
- Systems
- AMD
- UCFF
- USB4
- ASRock Industrial
- Rembrandt
- Ryzen 7000 Mobile
System Performance: Multi-Tasking
One of the key drivers of advancements in computing systems is multi-tasking. On mobile devices, this is quite lightweight - cases such as background email checks while the user is playing a mobile game are quite common. Towards optimizing user experience in those types of scenarios, mobile SoC manufacturers started integrating heterogeneous CPU cores - some with high performance for demanding workloads, while others were frugal in terms of both power consumption / die area and performance. This trend is now slowly making its way into the desktop PC space.
Multi-tasking in typical PC usage is much more demanding compared to phones and tablets. Desktop OSes allow users to launch and utilize a large number of demanding programs simultaneously. Responsiveness is dictated largely by the OS scheduler allowing different tasks to move to the background. Intel's Alder Lake processors work closely with the Windows 11 thread scheduler to optimize performance in these cases. Keeping these aspects in mind, the evaluation of multi-tasking performance is an interesting subject to tackle.
We have augmented our systems benchmarking suite to quantitatively analyze the multi-tasking performance of various platforms. The evaluation involves triggering a ffmpeg transcoding task to transform 1716 3840x1714 frames encoded as a 24fps AVC video (Blender Project's 'Tears of Steel' 4K version) into a 1080p HEVC version in a loop. ffmpeg is configured to use the x265 encoder, and the settings are configured to allow the CPU usage to be saturated across all cores. The transcoding rate is monitored continuously. One complete transcoding pass is allowed to complete before starting the first multi-tasking workload - the PCMark 10 Extended bench suite. A comparative view of the PCMark 10 scores for various scenarios is presented in the graphs below. Also available for concurrent viewing are scores in the normal case where the benchmark was processed without any concurrent load, and a graph presenting the loss in performance.
| UL PCMark 10 Load Testing - Digital Content Creation Scores | |||

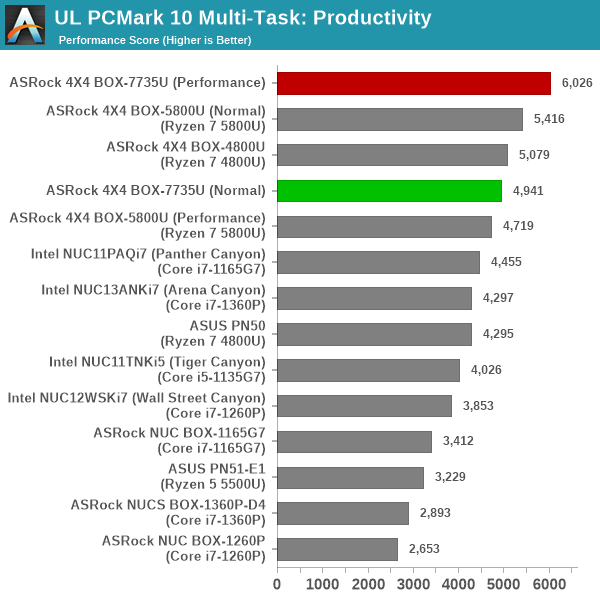
| UL PCMark 10 Load Testing - Productivity Scores | |||
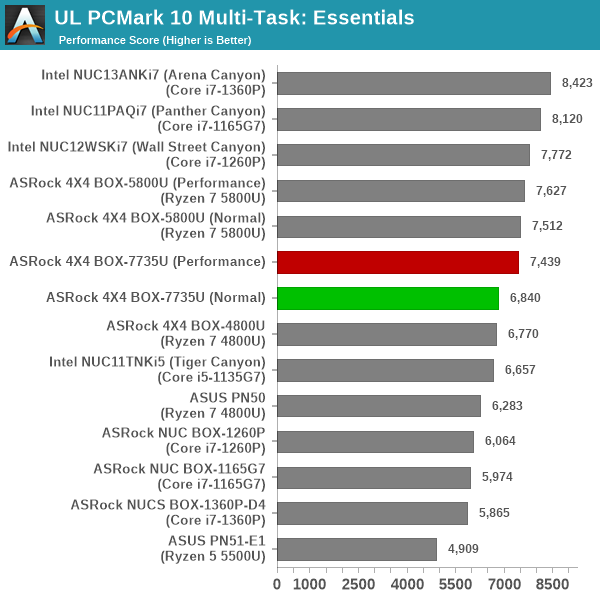
| UL PCMark 10 Load Testing - Essentials Scores | |||
| UL PCMark 10 Load Testing - Gaming Scores | |||

| UL PCMark 10 Load Testing - Overall Scores | |||
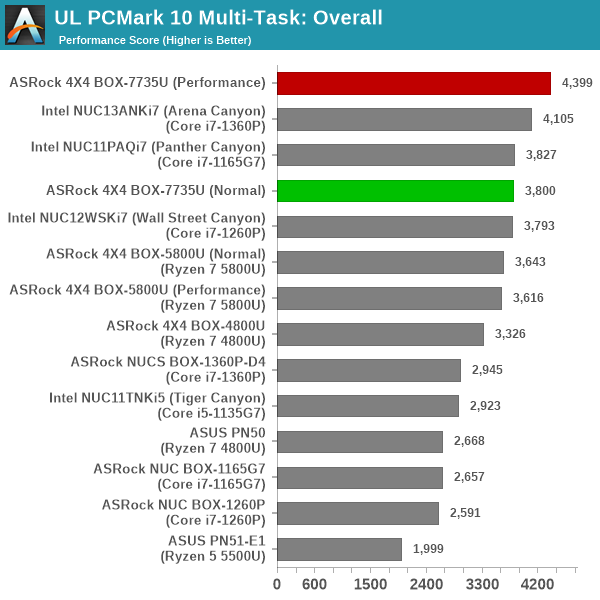
The relative ordering of the systems doesn't change much irrespective of the concurrent load. However, we do see a slight benefit for the heterogeneous processors when performance loss percentages are computed.
Following the completion of the PCMark 10 benchmark, a short delay is introduced prior to the processing of Principled Technologies WebXPRT4 on MS Edge. Similar to the PCMark 10 results presentation, the graph below show the scores recorded with the transcoding load active. Available for comparison are the dedicated CPU power scores and a measure of the performance loss.
| Principled Technologies WebXPRT4 Load Testing Scores (MS Edge) | |||

The final workload tested as part of the multitasking evaluation routine is CINEBENCH R23.
| 3D Rendering - CINEBENCH R23 Load Testing - Single Thread Score | |||

| 3D Rendering - CINEBENCH R23 Load Testing - Multiple Thread Score | |||

Without hetergeneous cores to worry about, we actually see the Rembrandt-R configurations acquitting themselves rather well in the rendering workloads which tend to stress the system more heavily and keep the workload across different threads largely the same. This is more challenging for ADL-P and RPL-P.
After the completion of all the workloads, we let the transcoding routine run to completion. The monitored transcoding rate throughout the above evaluation routine (in terms of frames per second) is graphed below.
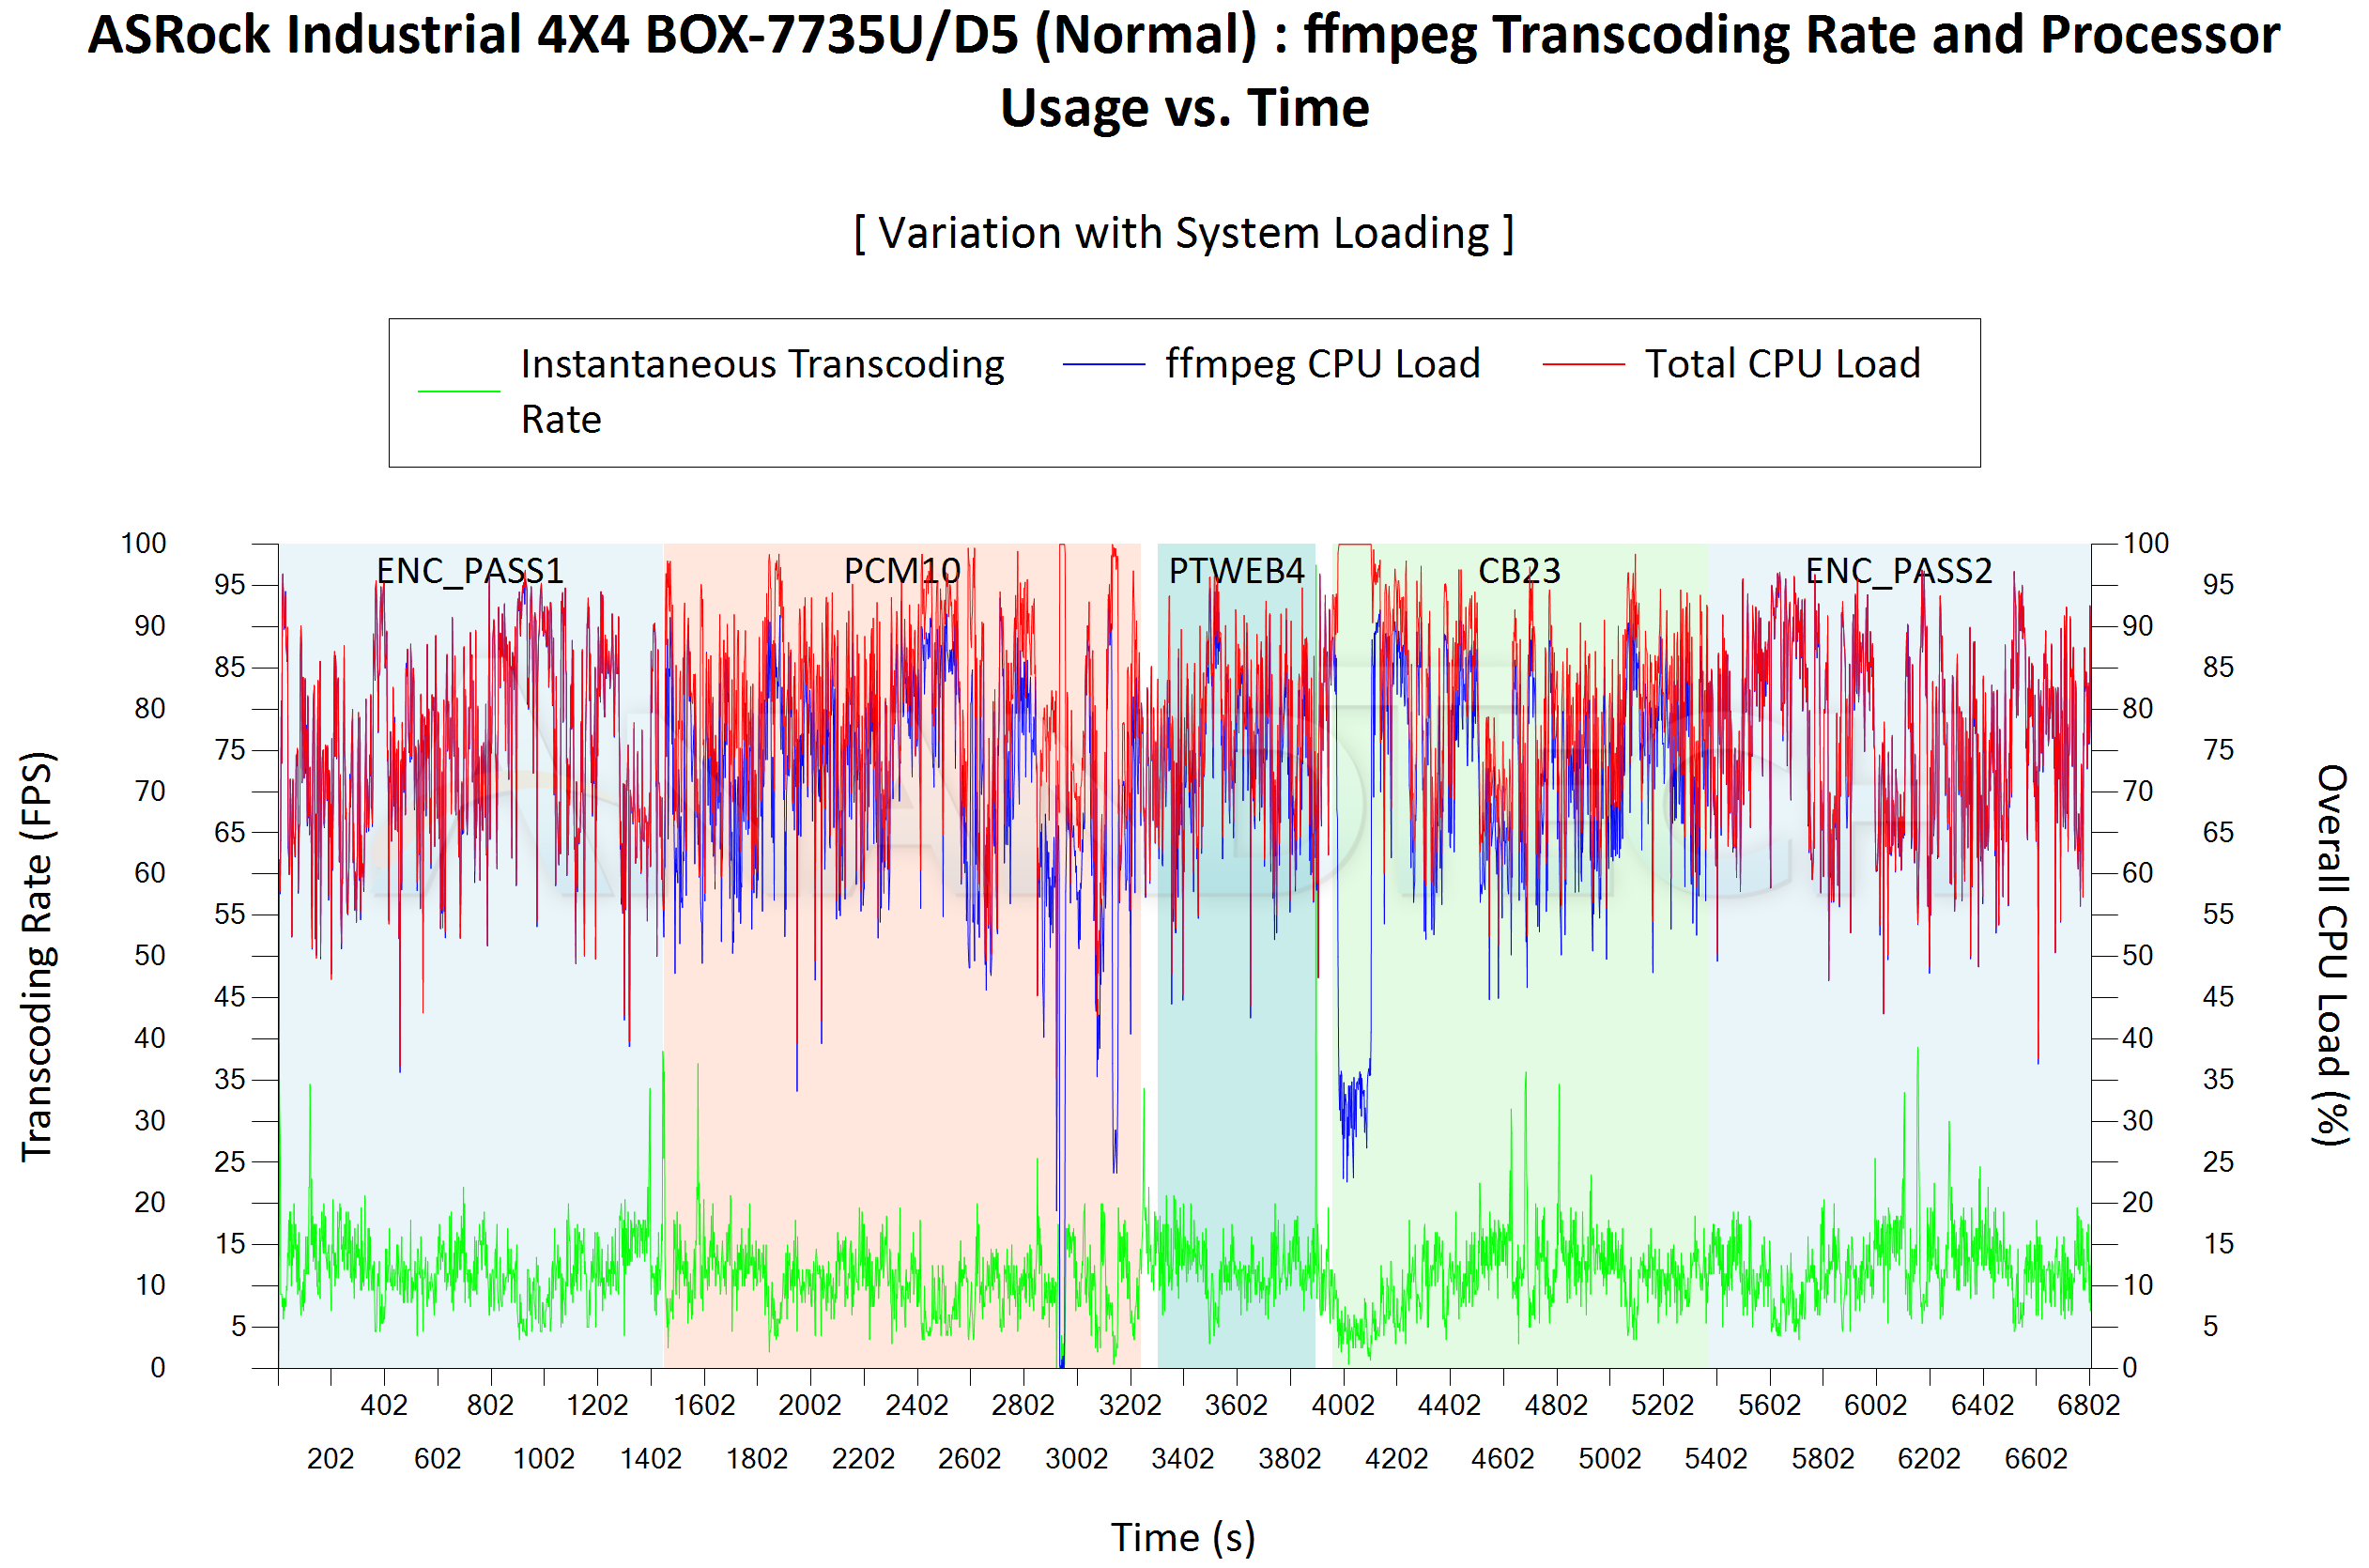

In the above scenario, the transcoding task is supposed to happen in the background. The user should ideally not care about the transcoding performance in that case, but it is still interesting to look into how that varies based on the concurrent load being applied.
| ASRock Industrial 4X4 BOX-7735U/D5 (Normal) ffmpeg Transcoding Rate (Multi-Tasking Test) | |||
| Task Segment | Transcoding Rate (FPS) | ||
| Minimum | Average | Maximum | |
| Transcode Start Pass | 3.5 | 12.2 | 39.5 |
| PCMark 10 | 0 | 10.55 | 37 |
| WebXPRT 4 | 3 | 12.16 | 21 |
| Cinebench R23 | 0.5 | 10.92 | 36 |
| Transcode End Pass | 3.5 | 12.26 | 39 |
| ASRock Industrial 4X4 BOX-7735U/D5 (Performance) ffmpeg Transcoding Rate (Multi-Tasking Test) | |||
| Task Segment | Transcoding Rate (FPS) | ||
| Minimum | Average | Maximum | |
| Transcode Start Pass | 4 | 14.09 | 43 |
| PCMark 10 | 0 | 12.41 | 38 |
| WebXPRT 4 | 4.5 | 12.6 | 23 |
| Cinebench R23 | 2.5 | 13.33 | 41 |
| Transcode End Pass | 3 | 14.12 | 43.5 |
Despite the addition of heavy concurrent loading, we see that the drop in transcoding performance is not too worrisome outside of full saturation regions from the foreground tasks.


35 Comments
View All Comments
5080 - Thursday, April 6, 2023 - link
Wondering if the 4X4 Box will be updated to the Ryzen 7 7840U or any of the other Phoenix based APU's in the near future.TheinsanegamerN - Thursday, April 6, 2023 - link
Yawn. Another ryzen 6000 rebrandeon product. Nobody cares about that, we want the zen 4+rDNA3 chips.And why oh why do these companies always put the thunderbolt on the front? Most thunderbolt devices are left plugged in, why would I want to dirty my desk with cables wrapped around the front of the PC?
lmcd - Thursday, April 6, 2023 - link
It has all of the IO improvements relevant to this form factor. Zen 4 barely moved the needle compared to Zen 3, and RDNA3's biggest gains were in high-CU yields via chiplets. This form factor doesn't even benefit notably from the expected mild Ryzen 7x4x efficiency improvements.TheinsanegamerN - Monday, April 10, 2023 - link
20%+ increase in perf/watt, only ~5% loss going from 125 to 45 watts, and better clock scaling are "minor". Sure. Dont forget rDNA3, which is supposed to be a 40%+ improvement despite the same CU count.How is that rock you are living under?
lmcd - Wednesday, April 12, 2023 - link
Zen 3 also scales down well, the difference is AMD wasn't advertising it.All of the improvements you listed are desktop 7000 platform vs desktop 5000 platform, and top SKU GPU vs top SKU GPU. Perf/watt improvements mostly came from the die shrink and improved bandwidth -- this platform has a die shrink and improved bandwidth, just the refined 6nm instead of newer 5nm. Clock scaling does not matter at these TDPs. RDNA3 performance literally cannot reach a 40% improvement over iso bandwidth (and there's no way the memory controller got completely reworked in a year's time).
It feels like you eat up hype. Ryzen 7x4x will be nice, but its goal is to be the successor to Ryzen 5000, not Ryzen 6000. Ryzen 6000 is an up-to-date platform that has barely even stretched its legs.
evolucion8 - Tuesday, April 25, 2023 - link
Intel in the other hand cant compete with AMD in the Sub 55W market with Zen 3+, let alone with Zen 4 ROFL.meacupla - Friday, April 7, 2023 - link
No, it's you who doesn't care.As it happens, this is a very fast APU, considering it is a rebranded 6000U series.
Asrock somehow managed to tune the settings so that it is achieving extremely good results in gaming.
As for front or rear ports, does it really matter? NUCs are best mounted on the backs of monitors anyways.
TheinsanegamerN - Monday, April 10, 2023 - link
It achieves the same as any ryzen 6000 chip with DDR5. There's no magic tuning, asrock just stopped gimping.And yes, port placement does matter.
StevoLincolnite - Wednesday, April 12, 2023 - link
No. Port placement doesn't matter on these devices. They are mounted behind monitors.abufrejoval - Sunday, April 16, 2023 - link
I own 5 NUCs, none was ever mounted to a monitor: they connect via a cascade of KVMs to a set of screens that have nothing mounted behind.I bought them for their low idle power and the small space they occupy under my desk. And they share that space with 6 Mini-ITX systems, four workstations and a set of semi-resident notebooks.
While I value that at least their RAM and storage can be explanded, I'd still prefer Mini-ITX mainboards in 5L boxes, because generally they allow me to have or put anything inside (e.g. 10Gbit NICs) that I have to hang e.g. via Thunderbolt to the outside of a NUC.
Unfortunately, getting "NUC power" in a Mini-ITX form factor has become nearly impossible, a very recent Erying G660 (https://wccftech.com/intel-alder-lake-h-laptop-cpu... which I've just added to my collection being one of the very few exceptions.
BTW that board works rather well, at least after upgrading the Pico-PSU to 120 Watts, even if it only consumes 45 Watts on sustained peak loads.
And thanks to a Noctua NH-L9i-17xx cooler it remains unnoticeable even under top load, something which the NUCs only ever achieve when you restrict their PL1/PL2/TAU settings to match their tiny fans.
Just remember that personal computers have been loved for decades, exactly because people could use them in ways that their vendors never imagined.