Intel Core i9-13900K and i5-13600K Review: Raptor Lake Brings More Bite
by Gavin Bonshor on October 20, 2022 9:00 AM ESTCPU Benchmark Performance: Science
Our Science section covers all the tests that typically resemble more scientific-based workloads and instruction sets. For our 2023 CPU suite, we've also added SciMark 2.0 which measures numerical kernels and various computational routines found in numeric coding.
We are using DDR5 memory on the Core i9-13900K, the Core i5-13600K, the Ryzen 9 7950X, and Ryzen 5 7600X, as well as Intel's 12th Gen (Alder Lake) processors at the following settings:
- DDR5-5600B CL46 - Intel 13th Gen
- DDR5-5200 CL44 - Ryzen 7000
- DDR5-4800 (B) CL40 - Intel 12th Gen
All other CPUs such as Ryzen 5000 and 3000 were tested at the relevant JEDEC settings as per the processor's individual memory support with DDR4.
Science
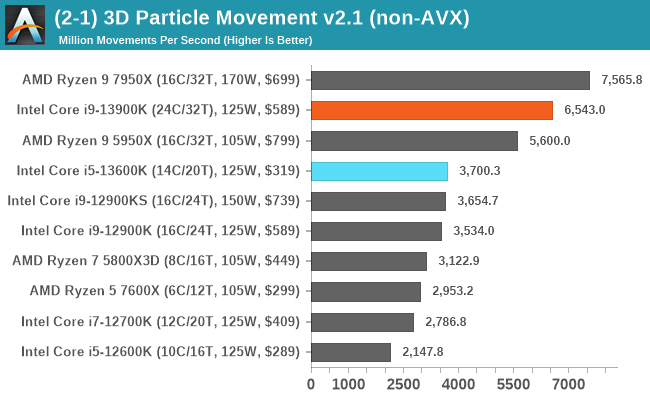
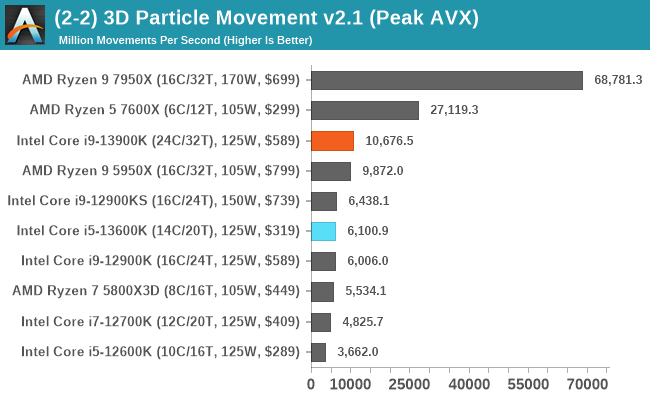
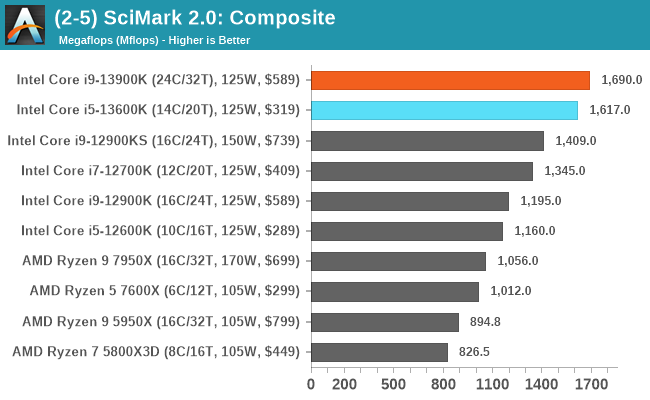
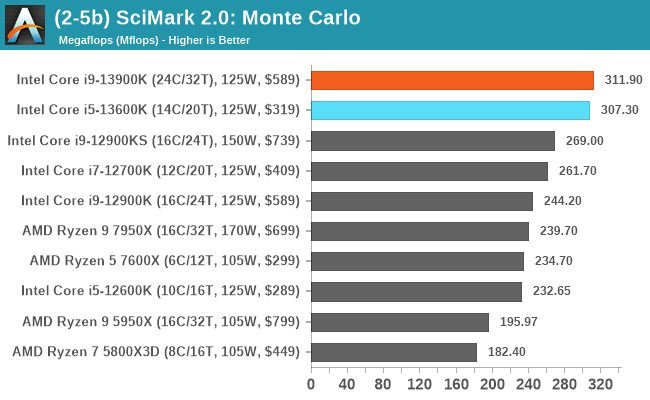
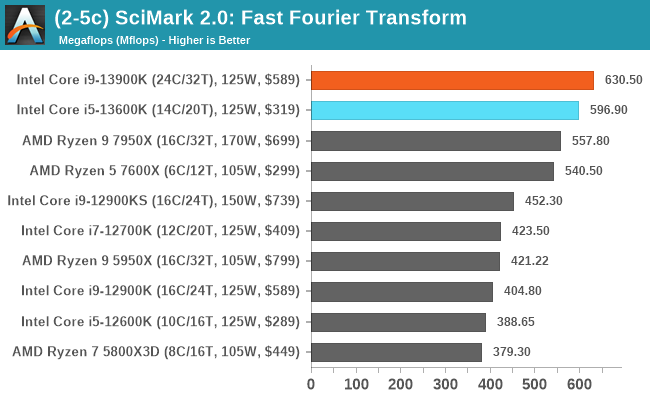
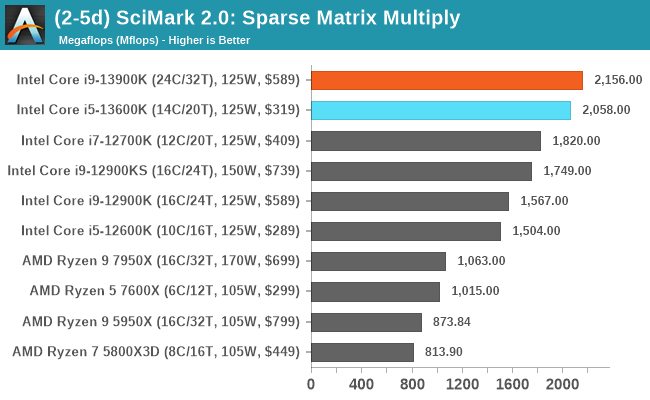
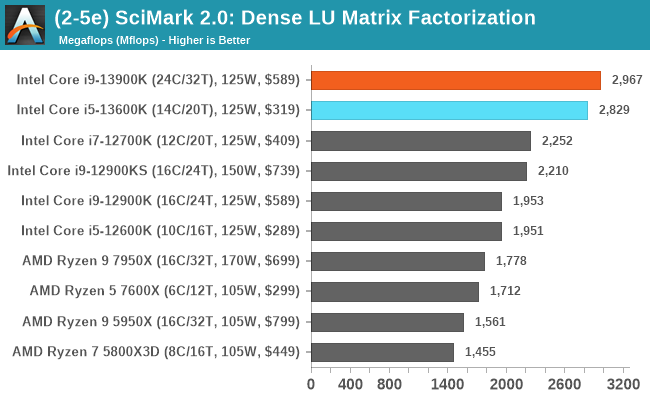
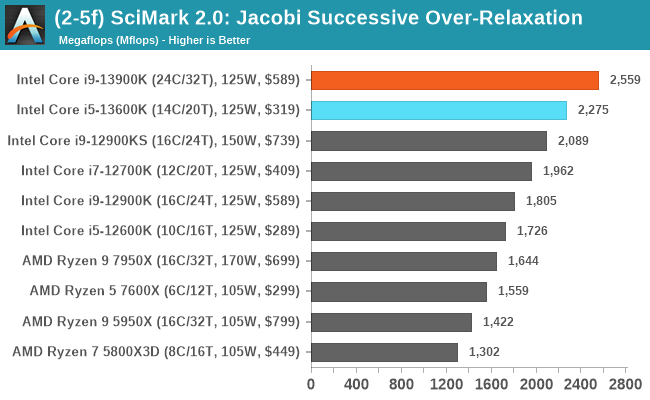
Outside of the 3DPM 2.1 AVX test (only Ryzen 7000 has AVX-512 enabled), the rest of the results are conclusive, the Core i9-13900K is very good as it dominates things in our SciMark 2.0 tests.
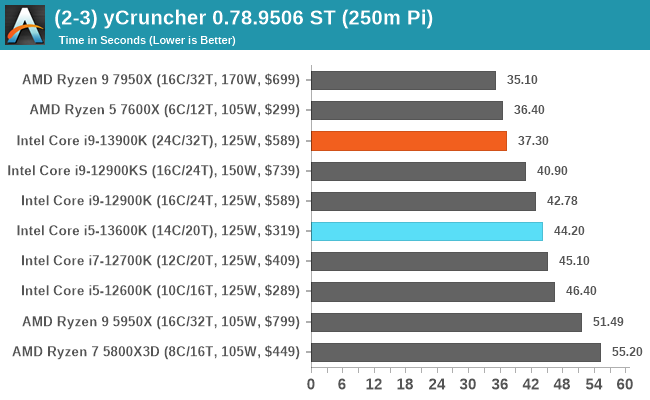
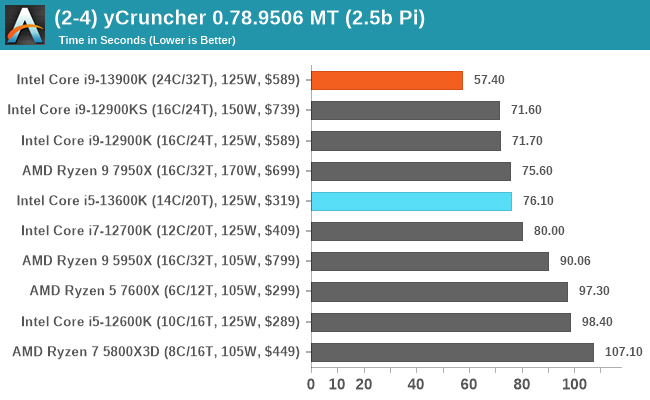
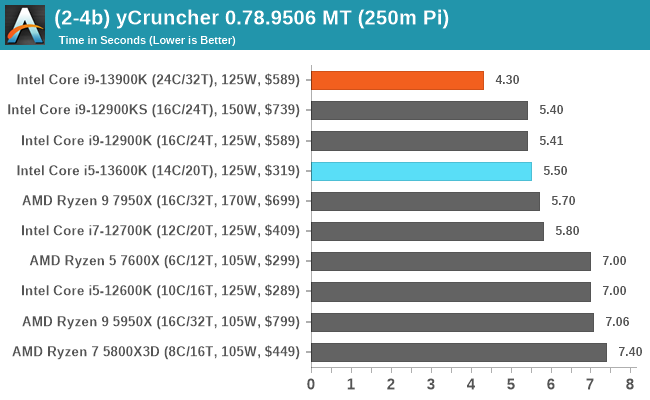
It is worth noting that in both 3DPM 2.1 (non-AVX) and in yCruncher, the AMD Ryzen 9 7950X is the clear winner in that battle, but even the Core i5-13600K does well against the previous Intel 12th Generation chips.


169 Comments
View All Comments
m53 - Thursday, October 20, 2022 - link
PCs are idle (or used for light browsing, reading bews, watching youtube or a movie, etc.) most of the time. Intel idles at around 12W due to E cores while AMD idles at around 45W which will make the energy consumption 4x. Replyt.s - Thursday, October 20, 2022 - link
idle around 45w? sources? My 5600G idle at 11W. others, around 7 s/d 17W. Replytitaniumrock - Thursday, October 20, 2022 - link
here is the source link https://www.youtube.com/watch?v=UNmpVvTUkJE&li... Replyt.s - Friday, October 21, 2022 - link
And where it states the AMD vs Intel watt vs watt? ReplyWrs - Friday, October 21, 2022 - link
A 5600g is a monolithic chip, just like the Intels. A 7600x or 7950x is a multi-chip module, though, with 2 or 3 modules, and the IOD idle is very substantial now with all the PCIe5 lanes. Bottom line Zen 4 is more efficient when doing major work, courtesy of being one process generation ahead, but Raptor Lake and Alder Lake idle lower. If you want low idle with Zen4, wait for the SoC variants like your 5600g. Replytygrus - Saturday, October 22, 2022 - link
They don't run constantly with at maximum power consumption in all workloads. They use less while gaming or more integer & less FP/AVX. Highest usage probably when they have a performance lead over the other. AMD can run at lower power limits & loose a few % in many cases. Replyneblogai - Thursday, October 20, 2022 - link
I was hoping for Ryzen 7000X iGPU benchmarks too. There are no proper comparisons of them vs Intel's 32EU iGPUs on the internet. Replynandnandnand - Thursday, October 20, 2022 - link
ETA Prime 7700X iGPU tests (no comparisons):https://www.youtube.com/watch?v=p4cwNn4kI6M (gaming)
https://www.youtube.com/watch?v=MnSVPM78ZaQ (emulation)
7600X vs. 12900 vs. 5700G
https://arstechnica.com/gadgets/2022/09/ryzen-7600...
All Zen 4 vs. 12900K vs. others
https://www.techpowerup.com/review/amd-ryzen-7-770...
It's similar to the UHD 770 in Alder Lake, sometimes a little better or worse. About half the performance of a 5700G which is impressive for 2 CUs.
UHD 770 in Raptor Lake gets +100 MHz across the board, so that could make a slight difference. Reply
neblogai - Thursday, October 20, 2022 - link
Thanks. I liked the ones on Techpowerup, as they include tests at 720p low, and tested more than a few titles. Part of my interest is the need to compare to Tomshardware 7950 iGPU results, which looked suspiciously low for the specs, and probably faulty: https://www.tomshardware.com/news/ryzen-7000-integ... ReplyCiccioB - Thursday, October 20, 2022 - link
About power consumption.I think it is completely useless to measure it when running a useless benchmark that you then don't even use to compare the relative performances to other CPUs.
It would be much worth having a measurement for some more useful (common?) benches, just to understand when a real work is applied how much the CPU is consuming and, related to the performances, understand how efficient it is.
Just think what the results would be if the CPU would be artificially limited (by BIOS/driver) in Prime95 bench: you would measure a much lower consumption that extrapolated for other tests, and you could just think the CPU is consuming a fraction of what is does. It's the same for the torture benches of GPUs. The max consumption in that test is useless to understand how much they really consume while gaming, and in fact, most of them are artificially limited or just hit the max TDP (which is again not a measure of power consumption).
If you don't want to provide the power consumption for most benches, at least use a bench that gives a comparable performance, so that (at least for that test) one can make a comparison of the efficiency. Reply