Intel Core i9-13900K and i5-13600K Review: Raptor Lake Brings More Bite
by Gavin Bonshor on October 20, 2022 9:00 AM ESTCPU Benchmark Performance: Simulation
Simulation and Science have a lot of overlap in the benchmarking world. The benchmarks that fall under Science have a distinct use for the data they output – in our Simulation section, these act more like synthetics but at some level are still trying to simulate a given environment.
In the encrypt/decrypt scenario, how data is transferred and by what mechanism is pertinent to on-the-fly encryption of sensitive data - a process by which more modern devices are leaning to for software security.
We are using DDR5 memory on the Core i9-13900K, the Core i5-13600K, the Ryzen 9 7950X, and Ryzen 5 7600X, as well as Intel's 12th Gen (Alder Lake) processors at the following settings:
- DDR5-5600B CL46 - Intel 13th Gen
- DDR5-5200 CL44 - Ryzen 7000
- DDR5-4800 (B) CL40 - Intel 12th Gen
All other CPUs such as Ryzen 5000 and 3000 were tested at the relevant JEDEC settings as per the processor's individual memory support with DDR4.
Simulation
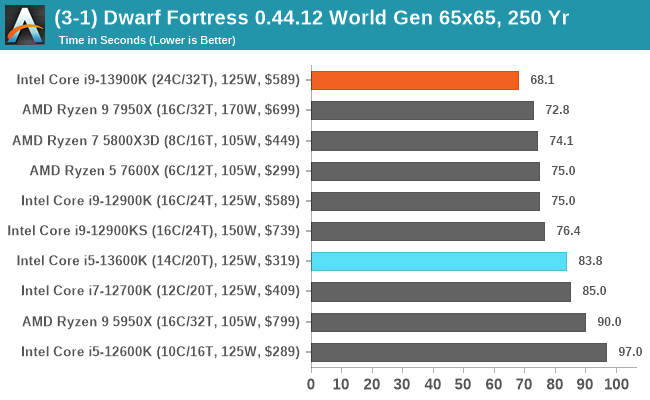
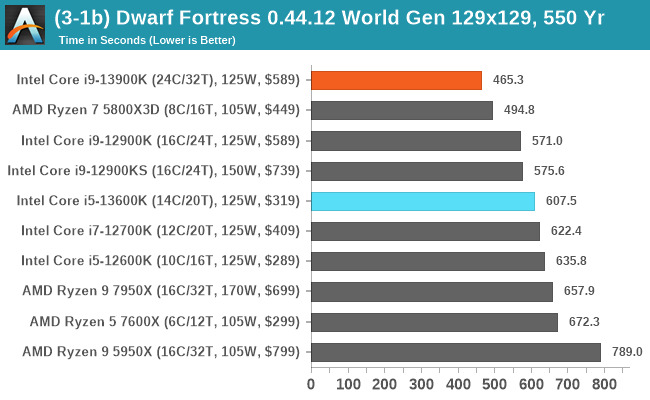
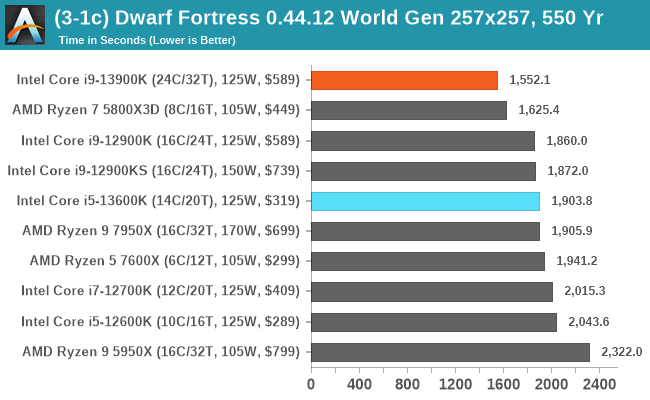
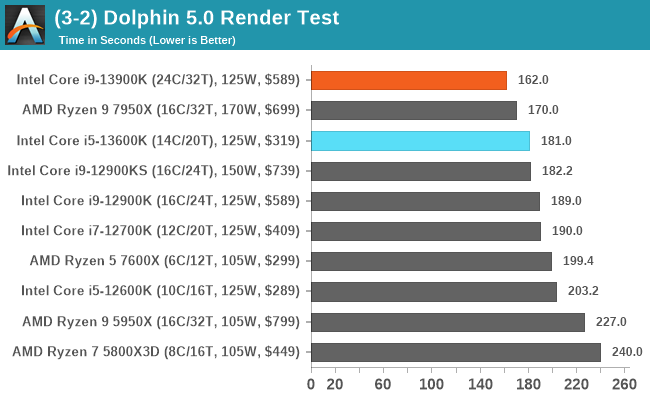
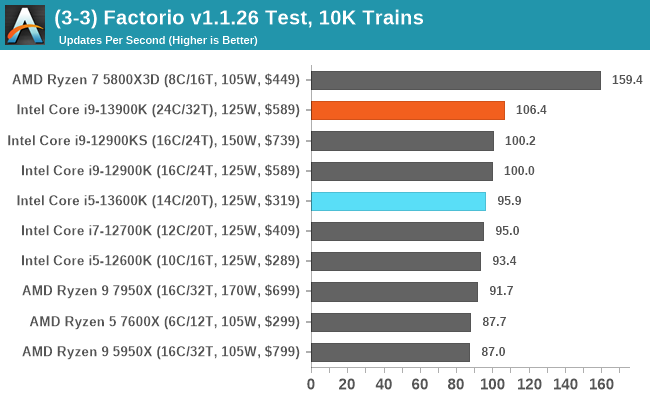
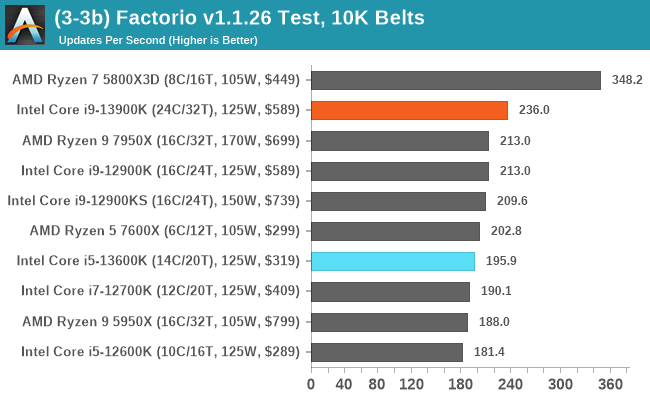
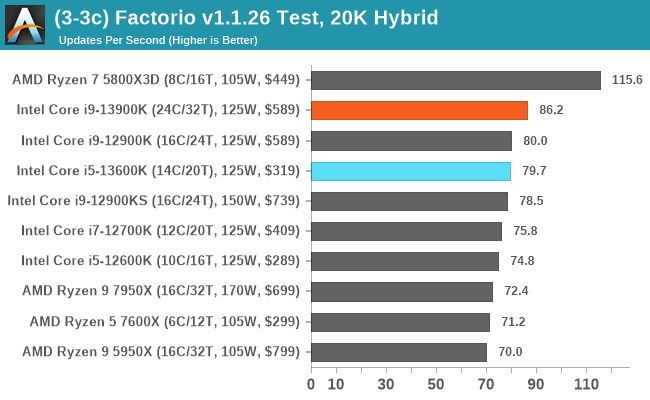
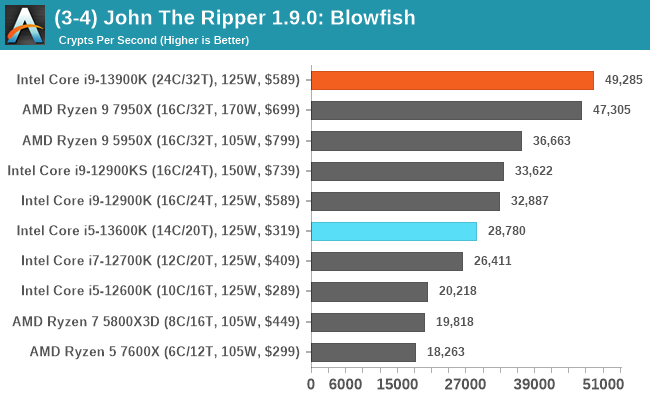
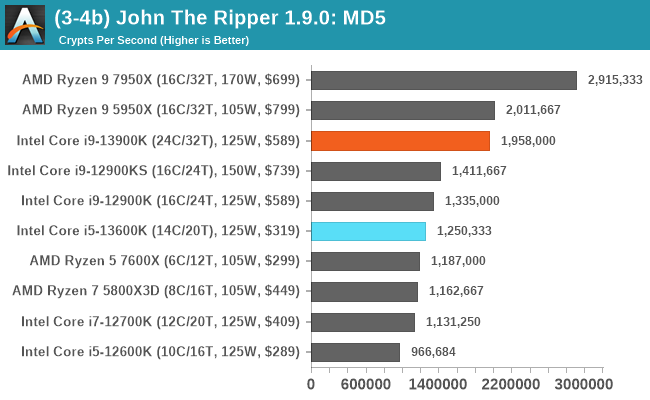
Outside of the AMD Ryzen 7 5800X3D's dominance in our Factorio testing, the rest of the results paint an interesting picture; the Core i9-13900K excels in simulations. Whether that's the addition of eight more efficiency cores over the Core i9-12900K, or that it's also partly due to increased core clock speeds, if it works, it works. The AMD Ryzen 9 7950X is also a solid contender, however, and it tears the competition a new one in our new John the Ripper MD5 test.


169 Comments
View All Comments
m53 - Thursday, October 20, 2022 - link
PCs are idle (or used for light browsing, reading bews, watching youtube or a movie, etc.) most of the time. Intel idles at around 12W due to E cores while AMD idles at around 45W which will make the energy consumption 4x. Replyt.s - Thursday, October 20, 2022 - link
idle around 45w? sources? My 5600G idle at 11W. others, around 7 s/d 17W. Replytitaniumrock - Thursday, October 20, 2022 - link
here is the source link https://www.youtube.com/watch?v=UNmpVvTUkJE&li... Replyt.s - Friday, October 21, 2022 - link
And where it states the AMD vs Intel watt vs watt? ReplyWrs - Friday, October 21, 2022 - link
A 5600g is a monolithic chip, just like the Intels. A 7600x or 7950x is a multi-chip module, though, with 2 or 3 modules, and the IOD idle is very substantial now with all the PCIe5 lanes. Bottom line Zen 4 is more efficient when doing major work, courtesy of being one process generation ahead, but Raptor Lake and Alder Lake idle lower. If you want low idle with Zen4, wait for the SoC variants like your 5600g. Replytygrus - Saturday, October 22, 2022 - link
They don't run constantly with at maximum power consumption in all workloads. They use less while gaming or more integer & less FP/AVX. Highest usage probably when they have a performance lead over the other. AMD can run at lower power limits & loose a few % in many cases. Replyneblogai - Thursday, October 20, 2022 - link
I was hoping for Ryzen 7000X iGPU benchmarks too. There are no proper comparisons of them vs Intel's 32EU iGPUs on the internet. Replynandnandnand - Thursday, October 20, 2022 - link
ETA Prime 7700X iGPU tests (no comparisons):https://www.youtube.com/watch?v=p4cwNn4kI6M (gaming)
https://www.youtube.com/watch?v=MnSVPM78ZaQ (emulation)
7600X vs. 12900 vs. 5700G
https://arstechnica.com/gadgets/2022/09/ryzen-7600...
All Zen 4 vs. 12900K vs. others
https://www.techpowerup.com/review/amd-ryzen-7-770...
It's similar to the UHD 770 in Alder Lake, sometimes a little better or worse. About half the performance of a 5700G which is impressive for 2 CUs.
UHD 770 in Raptor Lake gets +100 MHz across the board, so that could make a slight difference. Reply
neblogai - Thursday, October 20, 2022 - link
Thanks. I liked the ones on Techpowerup, as they include tests at 720p low, and tested more than a few titles. Part of my interest is the need to compare to Tomshardware 7950 iGPU results, which looked suspiciously low for the specs, and probably faulty: https://www.tomshardware.com/news/ryzen-7000-integ... ReplyCiccioB - Thursday, October 20, 2022 - link
About power consumption.I think it is completely useless to measure it when running a useless benchmark that you then don't even use to compare the relative performances to other CPUs.
It would be much worth having a measurement for some more useful (common?) benches, just to understand when a real work is applied how much the CPU is consuming and, related to the performances, understand how efficient it is.
Just think what the results would be if the CPU would be artificially limited (by BIOS/driver) in Prime95 bench: you would measure a much lower consumption that extrapolated for other tests, and you could just think the CPU is consuming a fraction of what is does. It's the same for the torture benches of GPUs. The max consumption in that test is useless to understand how much they really consume while gaming, and in fact, most of them are artificially limited or just hit the max TDP (which is again not a measure of power consumption).
If you don't want to provide the power consumption for most benches, at least use a bench that gives a comparable performance, so that (at least for that test) one can make a comparison of the efficiency. Reply