Intel Core i9-13900K and i5-13600K Review: Raptor Lake Brings More Bite
by Gavin Bonshor on October 20, 2022 9:00 AM ESTCore-to-Core Latency
As the core count of modern CPUs is growing, we are reaching a time when the time to access each core from a different core is no longer a constant. Even before the advent of heterogeneous SoC designs, processors built on large rings or meshes can have different latencies to access the nearest core compared to the furthest core. This rings true especially in multi-socket server environments.
But modern CPUs, even desktop and consumer CPUs, can have variable access latency to get to another core. For example, in the first generation Threadripper CPUs, we had four chips on the package, each with 8 threads, and each with a different core-to-core latency depending on if it was on-die or off-die. This gets more complex with products like Lakefield, which has two different communication buses depending on which core is talking to which.
If you are a regular reader of AnandTech’s CPU reviews, you will recognize our Core-to-Core latency test. It’s a great way to show exactly how groups of cores are laid out on the silicon. This is a custom in-house test, and we know there are competing tests out there, but we feel ours is the most accurate to how quick an access between two cores can happen.
(Click on image to enlarge)
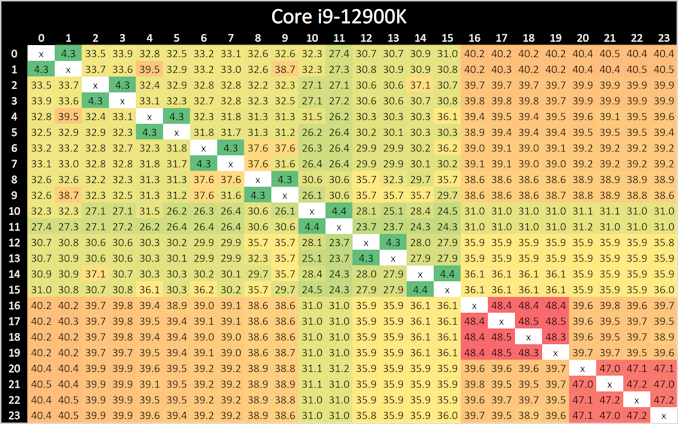
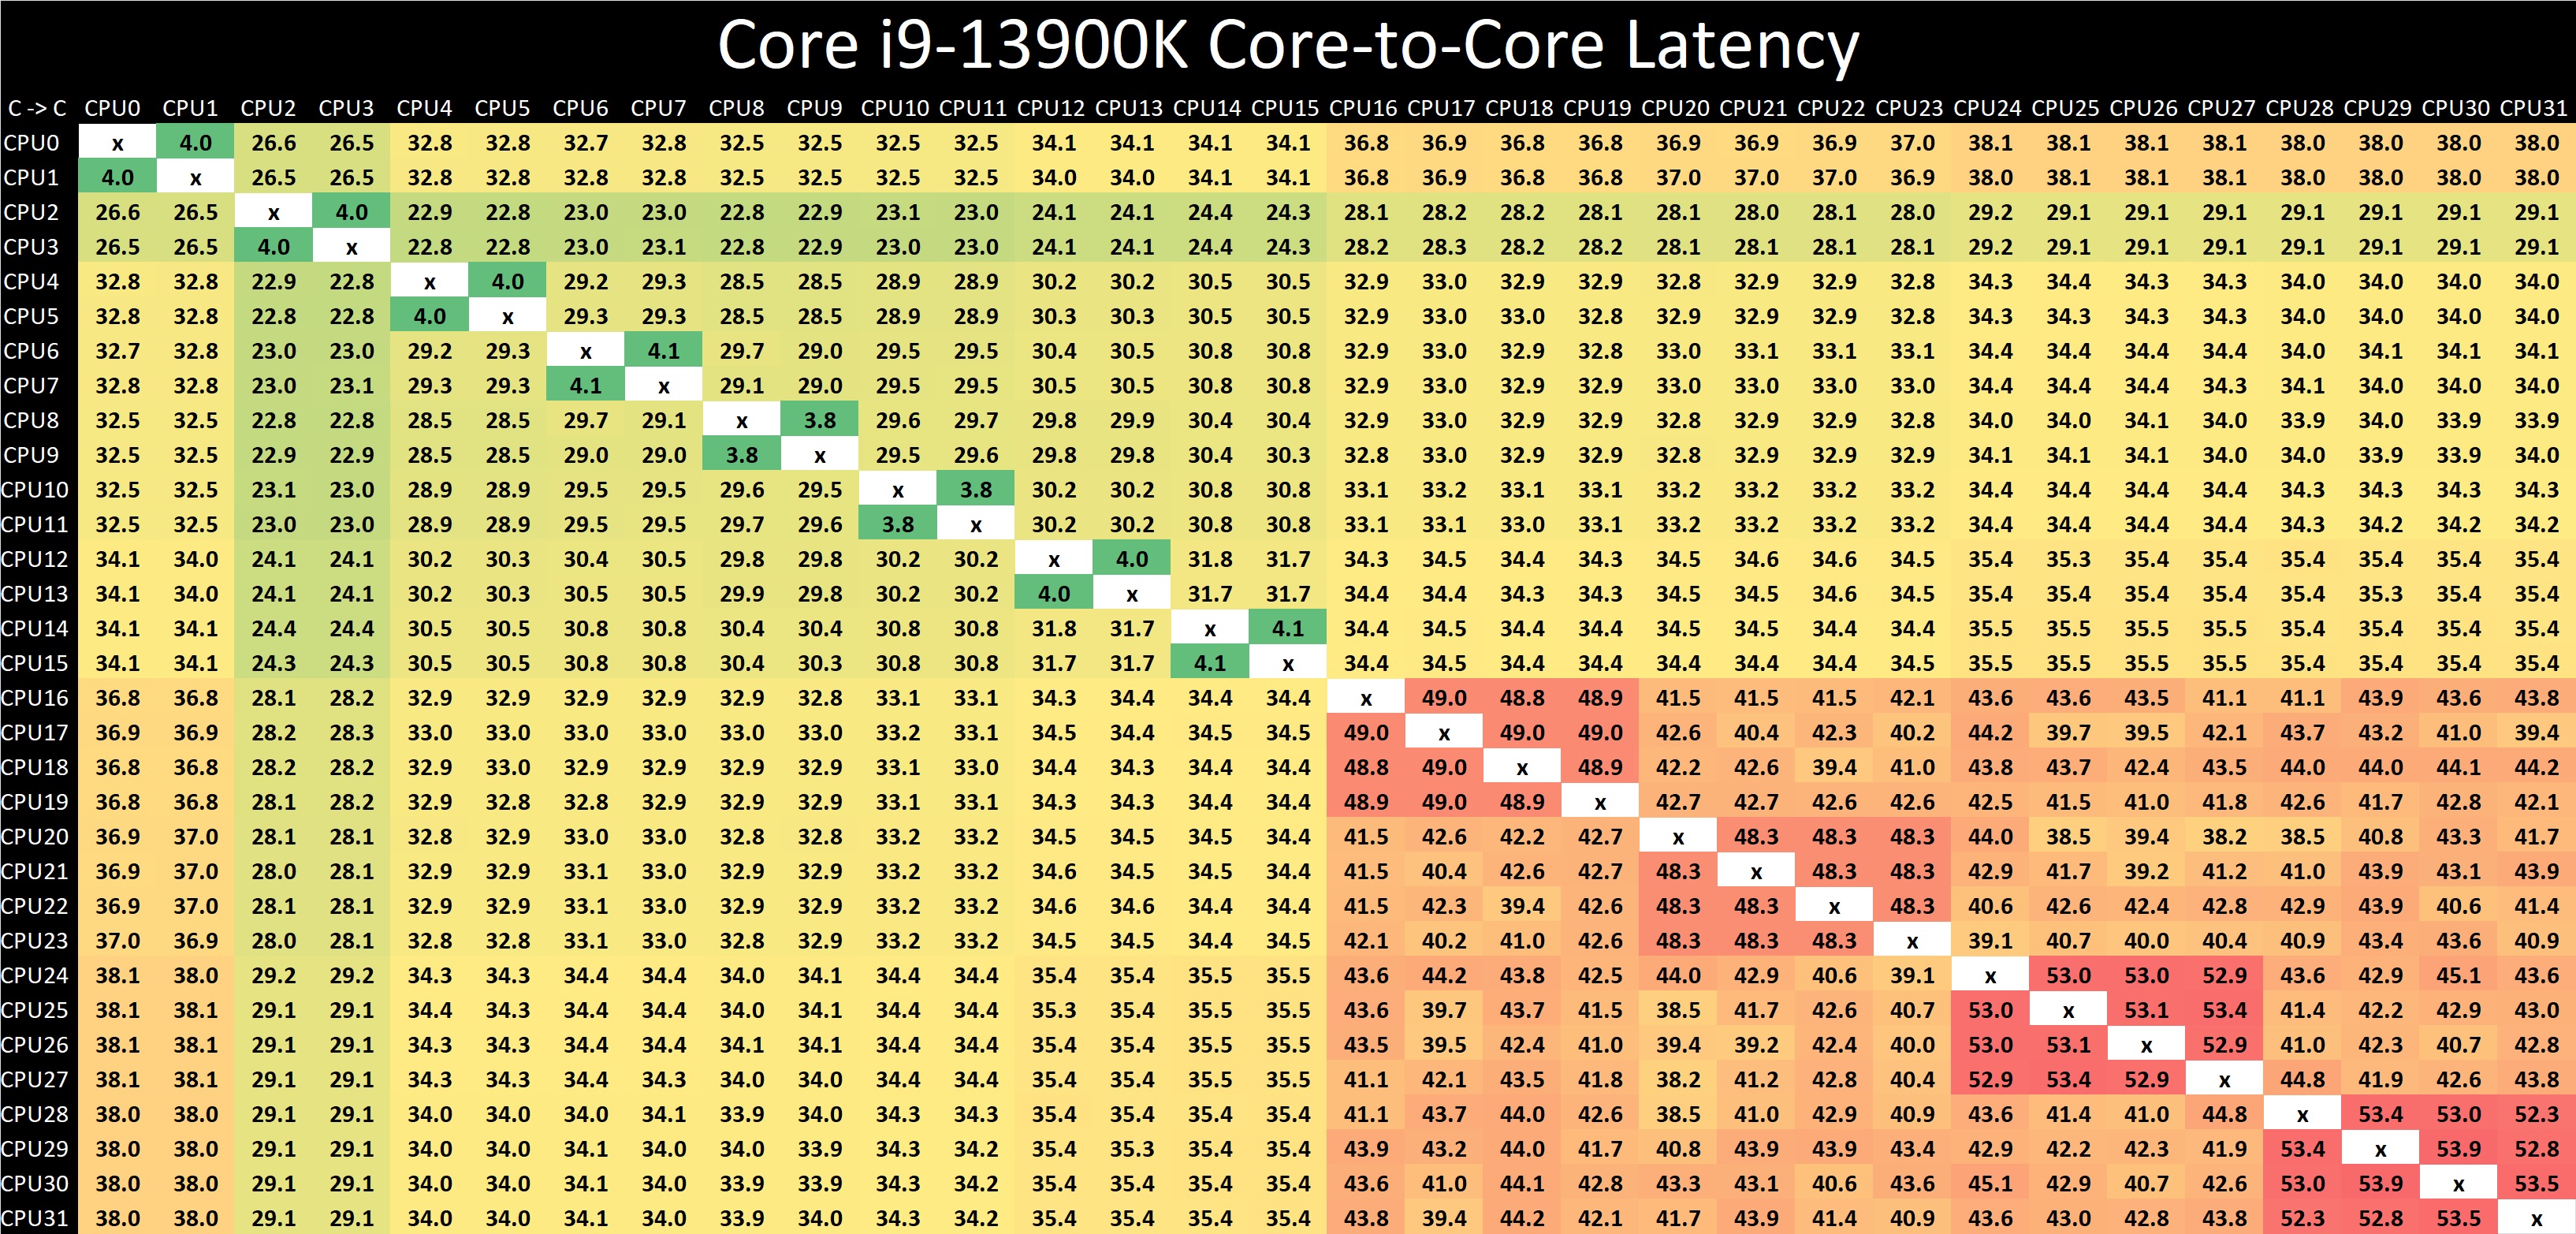
Looking at core-to-core latencies going from Alder Lake (12th Gen) to Raptor Lake (13th Gen), things look quite similar on the surface. The P-cores are listed within Windows 11 from cores 0 to 15, and in comparison to Alder Lake, latencies are much the same as what we saw when we reviewed the Core i9-12900K last year. The same comments apply here as with the Core i9-12900K, as we again see more of a bi-directional cache coherence.
Latencies between each Raptor Cove core have actually improved when compared to the Golden Cove cores on Alder Lake from 4.3/4.4 ns, down to 3.8/4.1 ns per each L1 access point.
The biggest difference is the doubling of the E-cores (Gracemont) on the Core i9-13900K, which as a consequence, adds more paths and crossovers. These paths do come with a harsher latency penalty than we saw with the Core i9-12900K, with latencies around the E-cores ranging from 48 to 54 ns within four core jumps between them; this is actually slower than it was on Alder Lake.
One possible reason for the negative latency is the 200 MHz reduction in base frequency on the Gracemont cores on Raptor Lake when compared with Alder Lake. When each E-core (Gracemont) core is communicating with each other, they travel through the L2 cache clusters via the L3 cache ring and back again, which does seem quite an inefficient way to go.


169 Comments
View All Comments
brucethemoose - Thursday, October 20, 2022 - link
x264 is (more or less) the same thing as the handbrake test... and it kinda is legacy software at this point.Personally, I'd like to see a more modern encoding test, like av1an with x265+chunked encoding, or maybe Staxrip with some filters enabled. Reply
GeoffreyA - Thursday, October 20, 2022 - link
Yes, some libaom would be fantastic. Replyjakky567 - Monday, October 24, 2022 - link
I wouldn't say handbrake/x264 are obsolete yet. We should be looking towards the future, but h264 is here to stay as at least a fallback codec. ReplyGeoffreyA - Tuesday, October 25, 2022 - link
It is very much the MP3 of video and here to stay. Plus, its successors have not been indisputably better or have come with tradeoffs. ReplyAshantus - Thursday, October 20, 2022 - link
Comparing the performance of 7600X vs 13600k i see some overall advantage for the 13600K.But, i will defionitly go for the 7600X due one argue.
Load Consumption of 134 Watt vs 238 Watt at almost same performance is something.
Regarding the poweer costs in europe of 60 cent per Watt that is quiet some pricing argue at a 5 years lifetime.
At anandtech:
this argue should be mentioned in your closing thoughts. 100 Watt more powerconsumption at todays powerprices is a serious issue. Reply
Yojimbo - Thursday, October 20, 2022 - link
I don't remember seeing power versus performance numbers. Did I miss them? ReplyCiccioB - Thursday, October 20, 2022 - link
<blockquote>Load Consumption of 134 Watt vs 238 Watt at almost same performance is something.</blockquote>This thought is completely wrong. It is called "induction", as you were looking at something and then reported that on something else.
You see a graph of power consumption for a "unlimited test" (where performance is not measured) and then you think that that measure is valid also for other tests.
So you just think that for each bench those CPUs consume always those Watts (how can it be?) and that the performance are the same (where did you got that? In almost all benches the 13600K leaves the 7600X in the dust, but not knowing their power consumption for those test you cannot say which is the most efficient). Reply
Ashantus - Thursday, October 20, 2022 - link
Just found another test, whereas a powerconsumption at action is recorded.At gaming (average out of 12 games tested) is:
13600k = 88 W. 7600X = 60 W
13990K = 144 W 7900X = 107W Reply
Yojimbo - Thursday, October 20, 2022 - link
that looks more plausible. but it is also mostly useless except in the context of the specific workload. modern cpu performance testing is very complicated and performance versus power should be taken in the specific workload one is interested in, or at the very least an average of workloads of a similar type. ReplyGastec - Sunday, October 23, 2022 - link
Specific workload such as : 13990K produces 100 fps @ 144 W, while 7600X produces 100 fps @ 60 W? Reply