Intel Core i9-13900K and i5-13600K Review: Raptor Lake Brings More Bite
by Gavin Bonshor on October 20, 2022 9:00 AM ESTSPEC2017 Multi-Threaded Results
Single-threaded performance is only one element in regard to performance on a multi-core processor, and it's time to look at multi-threaded performance in SPEC2017. Although things in the single-threaded SPEC2017 testing showed that both Zen 4 and Raptor Lake were consistently at loggerheads, let's look at data in the Rate-N multi-threaded section.
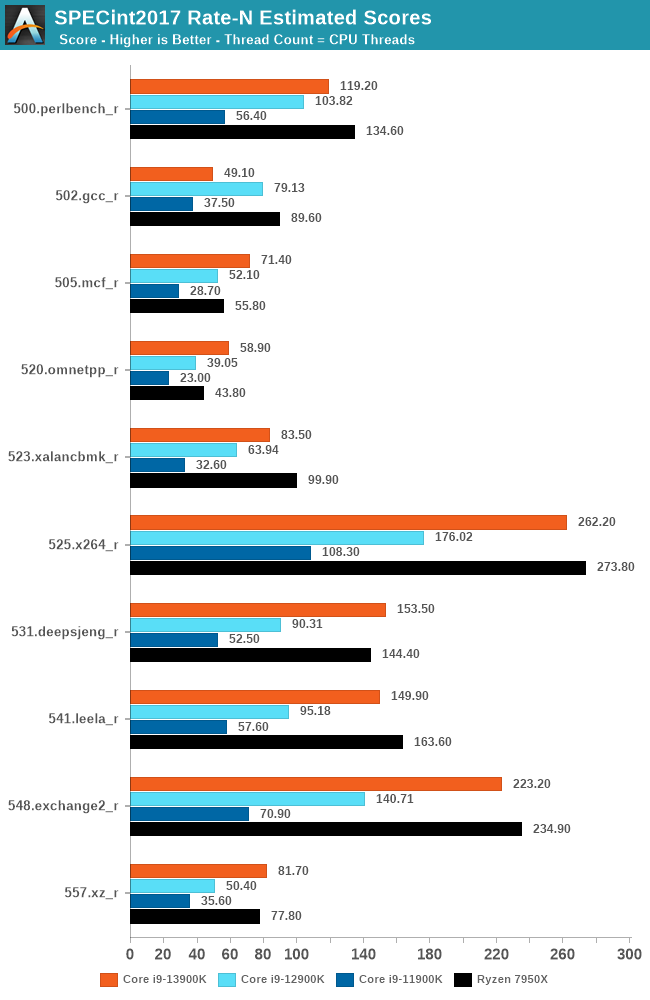
Looking at the data in our first part of SPEC2017 (int) nT testing, we're seeing similar trade-offs between Raptor Lake (13th Gen) and Zen 4 (Ryzen 7000) platforms. While Raptor Lake won in the 500.perlbench_r single-threaded test, Zen 4 has the lead by around 13% in multi-threaded performance, despite the Core i9-13900K having eight more physical cores (albeit efficiency cores).
One stand-out part of our SPECint2017 multi-threaded testing is just how far ahead the Core i9-13900K is ahead of the previous Core i9-12900K in multi-threaded tests. This comes thanks to more cores (2x the E-cores), and higher turbo frequencies. For example, in the 525.x264_r test, the Core i9-13900K is nearly 50% better than the i9-12900K; the only part where Raptor Lake failed to outperform Alder Lake was in the 502.gc_r test.
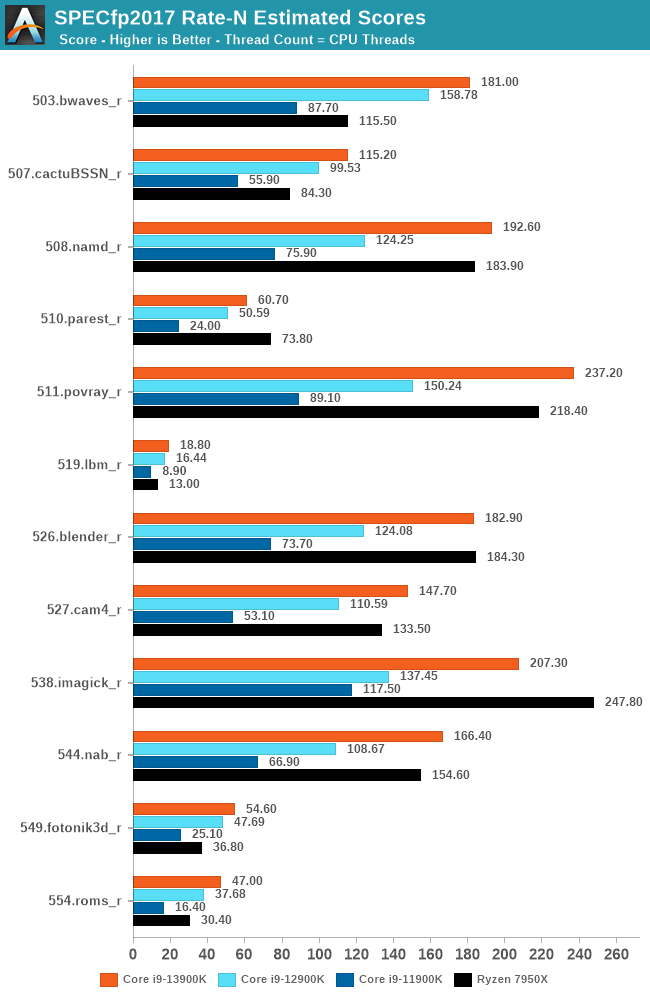
Moving onto the second half of our SPEC2017 multi-threaded results (Floating Point), the Core i9-13900K really does show itself to be a formidable force compared to Zen 4. In the majority of SPECfp2017 tests, the Core i9-13900K is ahead in multi-threaded performance. The improvements in overall performance from Rocket Lake (11th Gen) to Alder Lake were decent, but the improvement from Rocket Lake last year in Q1 2021 to Raptor Lake today – a more useful metric for the usual 2-4 year hardware upgrade cycle – is very impressive indeed.
Summarizing the SPEC2017 multi-threaded results, in some areas Zen 4 is the winner, some areas Raptor Lake (Raptor Cove + Gracemont) is the winner. It is incredibly close in quite a few of the tests, and without sounding negative on the Zen 4 architecture here, but Intel has done a very good job bridging that initial gap to make things competitive against AMD's best.
Update 18/07/23
Following on from our initial results in our SPECint2017 Rate multi-threaded testing of the Core i9-13900K, we wanted to investigate the 502.gcc_r result, which we believed to be an anomaly of sorts. We observed a score of 49.1 on the Core i9-13900K, which, compared to the previous generation Core i9-12900K, is a regression in performance; the result was around 37% lower than the previous generation.
To investigate further, we've re-tested the Core i9-13900K using SPEC2017 Rate to identify any issues and to see if we could further replicate the issue or, at the very least, provide a more up-to-date list of results.
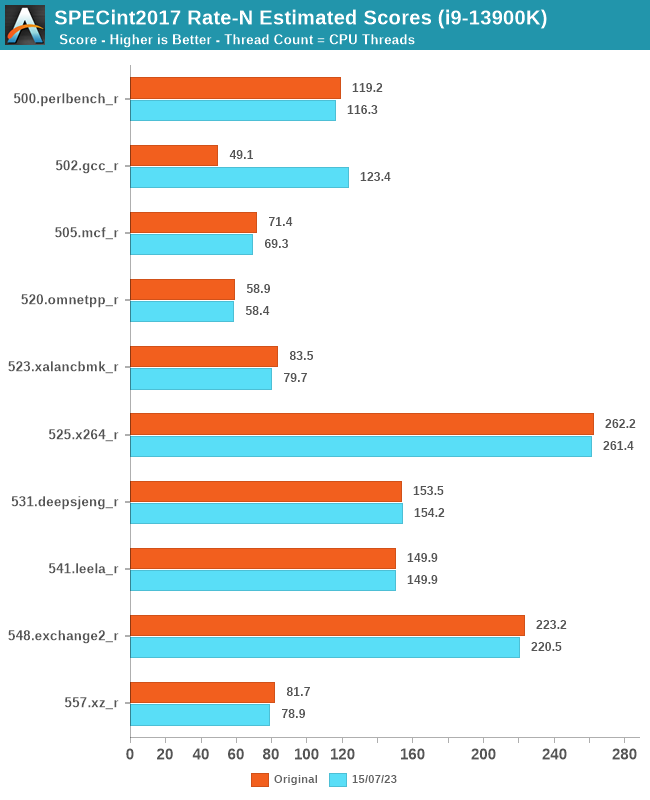
Looking at our updated SPECin2017 results, we are comparing the original Core i9-13900K data to the new data for comparative purposes. Although the results are very similar in many cases, we can see some slight regression in a few results, which could be attributed to various factors, including Windows 11's scheduler, power budget, or just general variance in running.
The biggest highlight of our re-test is the 502.gcc_r result, which seems to be an anomaly for the original run. We've run SPEC2017 numerous times to confirm that the above results are exactly where they should be.
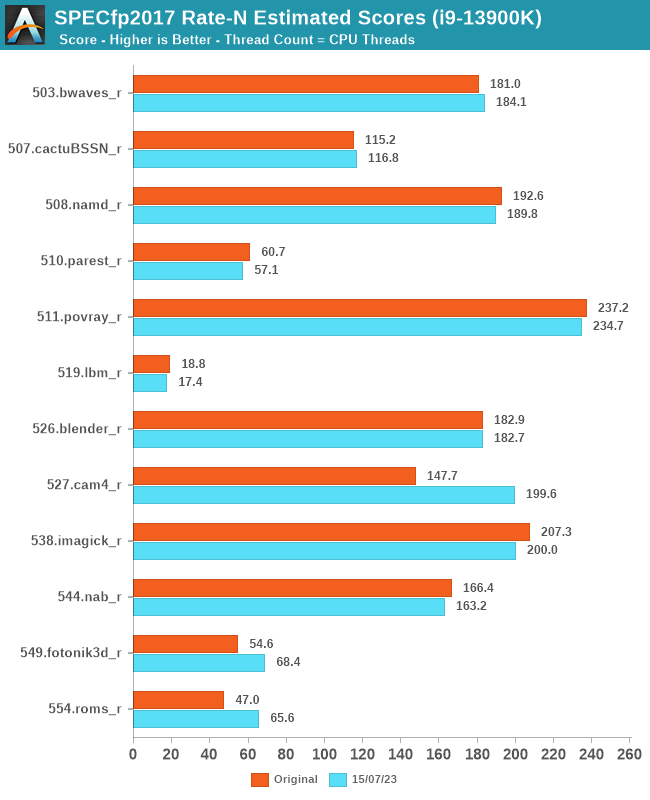
Focusing on our latest results for SPECfp2017 Rate N, we can see a similar story, with very similar results in multi-threaded SPEC2017 performance as with our original testing. In fact, a couple of the results yielded slightly higher results, which could be simply down to scheduler maturity, OS-related improvements including the scheduler, or overall firmware maturity. The results include 527.cam4_r, 549.fotonik3d_r, and 554.roms_r, which show better gains in our latest testing, especially compared to the Core i9-12900K, which this chip replaced in the market.
The biggest takeaway from our re-testing is the updated SPECint2017 Rate-N result for 502.gcc_r, which shows that our original results were nothing more than an anomaly, and we've been unable to replicate the issue.
Update: 07/22/23
We are aware of potential issues with memory capacity, and as such, we are re-running the Core i9-13900K with higher capacity DDR5 memory at JEDEC settings relevant to the platform. We have done a run with 64 GB instead of the regular 32 GB, which with the Core i9-13900K is 2 GB per thread (2 GB x 32 = 64 GB). Looking at preliminary results, we aren't seeing any major variances in these results.


169 Comments
View All Comments
adenta180 - Friday, June 23, 2023 - link
Did you guys ever get to the bottom of this SPECint rate GCC regression on 13900K? ReplyAvalon - Friday, October 21, 2022 - link
I think it's starting to become a little disingenuous to list the default TDP in the benchmarks, when it's become increasingly obvious over the past few generations that Intel chips run nowhere in the stratosphere of those TDPs.When you see a "125W" $589 chip virtually tied with a "170W" $699 chip it makes it seem like Intel is a no brainer. Might be time to start putting actual power draw in each of the tests in there, or simply leave stock TDP out, because listing a Core i9 at "125W" when it's running 50-100W higher than an equivalent AMD chip doesn't make much sense any longer. Reply
WannaBeOCer - Friday, October 21, 2022 - link
Did you even read the article? Intel advertises the 13900k as a 253w chip. It drew 32% more than it advertised while AMD advertises its 7950x as a 170w and it drew 30% more than they advertised. On all of Intel’s slides“Processor Base Power
125 W
Maximum Turbo Power
253 W” Reply
bcortens - Saturday, October 22, 2022 - link
Doesn’t matter if they advertise it. The charts are misleading because the W number at the left of the chart has nothing to do with the power consumed to get the performance indicated in the chart.They should really just leave the W number off or show a measured average W required to complete the test. Then the number would have meaning. As it stands, for the purposes of the graph, the number doesn’t mean much. Reply
Avalon - Friday, October 21, 2022 - link
And, to be fair to Intel, why are some of the IGP gaming benchmarks only showing the 12th and 13th gen Intel vs AMD APUs? There's really nothing to be gleaned from this; of course APUs will be faster in IGP tests. If you can't do like for like, then either just publish the Intel scores or don't publish at all. ReplyIketh - Friday, October 21, 2022 - link
In your closing comments about power consumption, I was reminded about the AMD article that compared the performance difference between 230W and 65W. I think you should also mention that in this article. I'm holding out for AMD mobile parts. Those laptops will be nice. ReplyIketh - Friday, October 21, 2022 - link
125W on Intel 7 process, when it's actually 325W on 10nm lmao... pure marketing ReplyWannaBeOCer - Friday, October 21, 2022 - link
Did you even read the article? Intel advertises the 13900k as a 253w chip. It drew 32% more than it advertised while AMD advertises its 7950x as a 170w and it drew 30% more than they advertised. On all of Intel’s slides“Processor Base Power
125 W
Maximum Turbo Power
253 W” Reply
bcortens - Saturday, October 22, 2022 - link
Reviews shouldn’t care about the advertised power, or what it says in the bios when you set the “limit” to 65 watts, reviews should actually measure and report the real power draw.We don’t read reviews to read intel and amd marketing numbers, we want to know the real numbers for a given workload Reply
Iketh - Sunday, October 23, 2022 - link
what on earth does that have to do with my statement Reply