Intel Atlas Canyon (NUC11ATKPE) and GEEKOM MiniAir 11 UCFF PCs Review: Desktop Jasper Lake Impresses
by Ganesh T S on July 14, 2022 8:00 AM ESTSystem Performance: Multi-Tasking
One of the key drivers of advancements in computing systems is multi-tasking. On mobile devices, this is quite lightweight - cases such as background email checks while the user is playing a mobile game are quite common. Towards optimizing user experience in those types of scenarios, mobile SoC manufacturers started integrating heterogeneous CPU cores - some with high performance for demanding workloads, while others were frugal in terms of both power consumption / die area and performance. This trend is now slowly making its way into the desktop PC space.
Multi-tasking in typical PC usage is much more demanding compared to phones and tablets. Desktop OSes allow users to launch and utilize a large number of demanding programs simultaneously. Responsiveness is dictated largely by the OS scheduler allowing different tasks to move to the background. Intel's Alder Lake processors work closely with the Windows 11 thread scheduler to optimize performance in these cases. Keeping these aspects in mind, the evaluation of multi-tasking performance is an interesting subject to tackle.
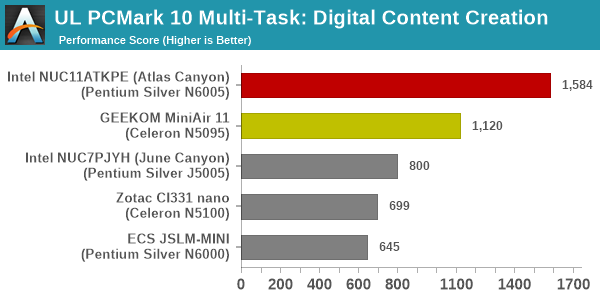
We have augmented our systems benchmarking suite to quantitatively analyze the multi-tasking performance of various platforms. The evaluation involves triggering a VLC transcoding task to transform 1716 3840x1714 frames encoded as a 24fps AVC video (Blender Project's 'Tears of Steel' 4K version) into a 1080p HEVC version in a loop. VLC internally uses the x265 encoder, and the settings are configured to allow the CPU usage to be saturated across all cores. The transcoding rate is monitored continuously. One complete transcoding pass is allowed to complete before starting the first multi-tasking workload - the PCMark 10 Extended bench suite. A comparative view of the PCMark 10 scores for various scenarios is presented in the graphs below. Also available for concurrent viewing are scores in the normal case where the benchmark was processed without any concurrent load, and a graph presenting the loss in performance.
| UL PCMark 10 Load Testing - Digital Content Creation Scores | |||
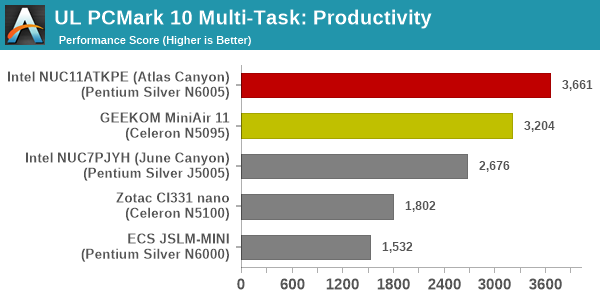
| UL PCMark 10 Load Testing - Productivity Scores | |||
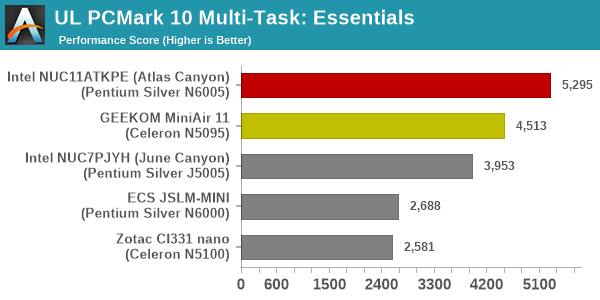
| UL PCMark 10 Load Testing - Essentials Scores | |||
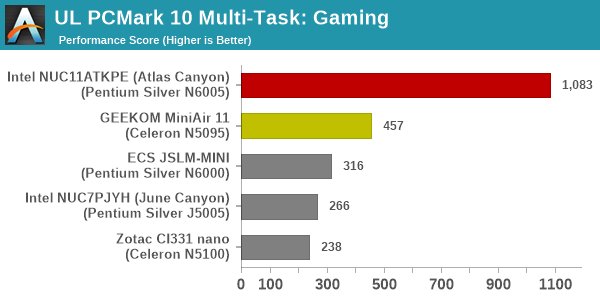
| UL PCMark 10 Load Testing - Gaming Scores | |||
| UL PCMark 10 Load Testing - Overall Scores | |||
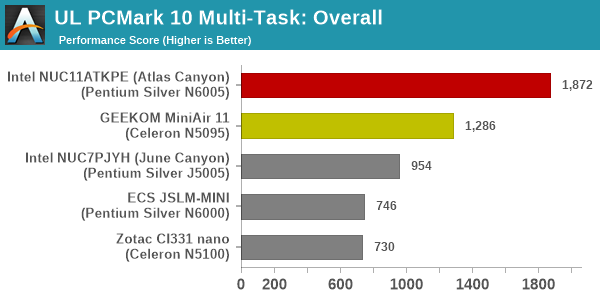
The MiniAir 11 turns out to be the best at handing the concurrent transcoding load - the loss in performance for various workloads is minimal, and allow it to slot in just behind the Atlas Canyon NUC across the board.
Following the completion of the PCMark 10 benchmark, a short delay is introduced prior to the processing of Principled Technologies WebXPRT4 on MS Edge. Similar to the PCMark 10 results presentation, the graph below show the scores recorded with the transcoding load active. Available for comparison are the dedicated CPU power scores and a measure of the performance loss.
| Principled Technologies WebXPRT4 Load Testing Scores (MS Edge) | |||
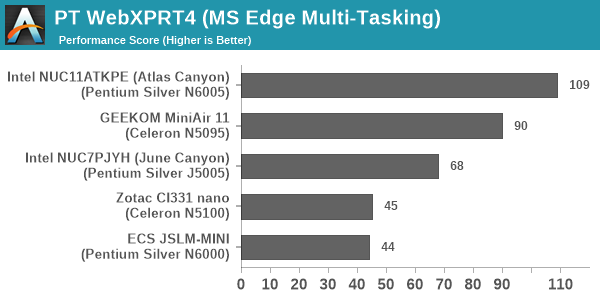
Addition of the transcoding load overwhelms the ECS JSLM-MINI - this causes it to slip well below the MiniAir 11 in the WebXPRT 4 workload. The MiniAir 11 moves up one spot to slot in behind the Atlas Canyon NUC.
The final workload tested as part of the multitasking evaluation routine is CINEBENCH R23.
| 3D Rendering - CINEBENCH R23 Load Testing - Single Thread Score | |||

| 3D Rendering - CINEBENCH R23 Load Testing - Multiple Thread Score | |||
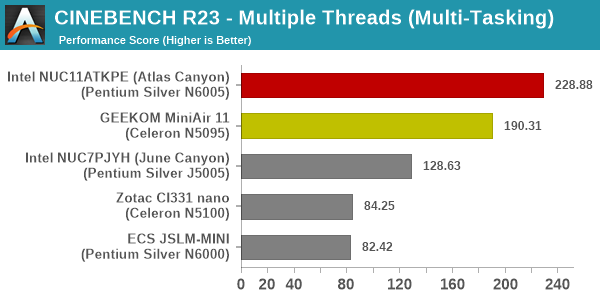
Addition of transcoding load lowers the 3D rendering performance, as expected. However, the relative ordering of the systems doesn't change.
After the completion of all the workloads, we let the transcoding routine run to completion. The monitored transcoding rate throughout the above evaluation routine (in terms of frames per second) is tabulated below.
| VLC Transcoding Rate (Multi-Tasking Test) - Frames per Second | |||||
| Enc. Pass #1 | PCMark 10 | WebXPRT4 | Cinebench | Enc. Pass #2 | |
| Intel NUC11ATKPE (Atlas Canyon) (Pentium Silver N6000) |
0.5224 | 0.5035 | 0.4133 | 0.4986 | 0.5243 |
| GEEKOM MiniAir 11 (Pentium Silver N6000) |
0.4543 | 0.4507 | 0.3674 | 0.4287 | 0.4608 |
The transcoding rates drop down with simultaneous loading, as expected. Both systems are actively-cooled. So, there is no extra throttling at play here, and the first and last encoding passes (which are free of other loads) have approximately the same transcoding rate.


21 Comments
View All Comments
JWade - Thursday, July 14, 2022 - link
comparing the two, how would they be if they had equal amounts of ram?dmill - Friday, July 15, 2022 - link
Can you also do an in depth review of the new HP 11 Windows tablet. Compared to the Surface Go3 and link the benchmarks from these NUCs and something like the Asus Vivobook 13 Slate so we can see how the thermals compare please. I want to get the HP, but I'm afraid HP may has castrated the performance.mode_13h - Friday, July 15, 2022 - link
Thanks for your ongoing coverage of machines built around Intel's efficiency-oriented CPUs.I appreciate the inclusion of Cinebench, compression, & other benchmarks, but what I'd really like to see are SPEC2017 numbers. Especially for the NUC, where I think they would tell us how these CPUs compare with many others you've covered.
DigitalFreak - Saturday, July 16, 2022 - link
Intel doesn't even use their own NICs. How sad.mode_13h - Sunday, July 17, 2022 - link
That's weird. Could it be related to fab capacity?t.s - Monday, July 18, 2022 - link
Nope. They usually differentiate their product. Below i3, you get realtek NIC. i3 and higher, you get intel NIC. below i3, you'll miss something like avx2 or others feature. i5 and higher, business use, you get vPro. And so on and on..George2022 - Sunday, July 17, 2022 - link
The progress over previous offerings in this class is obvious. Also visible is the lag due to the output delay. I hope Intel catches up next year with a significantly better product equipped with DDR5 RAM, and most modern external interfaces and inner technologies.mode_13h - Sunday, July 17, 2022 - link
I doubt they'll use DDR5, at this level. It's not really necessary and still commands a price premium that doesn't make a lot of sense for such a budget platform. Maybe its best selling point for systems at this price tier would be the performance improvement on single-DIMM configurations.Bruzzone - Sunday, July 17, 2022 - link
Panther Lake Tiger NUC 11 was a failure and barely produced beyond sample volume. Tremont Jasper Lake was introduced in February 2021 but did not ship till April and the J desktop version was not shipped at all until Atlas Canyon NUC that is a full 15 months after mobile N offerings became available. This week in the WW channel N mobile devices represent approximately the same volume in the channel as Alder i3 which is only 2.5% of AL for the week running 1.98% of full run volume to date. To date jasper Lake N mobile sales have been flat and only Celeron N4500 cleared down 43% in the last 11 weeks which is some sort of flushing because otherwise N sales are basically flat since launch. Speaks of Atlas Canyon? mb