The Apple A15 SoC Performance Review: Faster & More Efficient
by Andrei Frumusanu on October 4, 2021 9:30 AM EST- Posted in
- Mobile
- Apple
- Smartphones
- Apple A15
GPU Performance - Great GPU, So-So Thermals Designs
The GPUs on the A15 iPhones are interesting, this is the first time that Apple has functionally segmented the GPU configurations on their SoCs within the iPhone device range, with the iPhone 13 mini and iPhone 13 receiving a 4-core GPU, similar to the A14 devices last year, while the 13 Pro and 13 Pro Max receive a 5-core variant of the SoC. It’s still the same SoC and silicon chip in both cases, just that Apple is disabling one GPU core on the non-Pro models, possibly for yield reasons?
Apple’s performance figures for the GPU were also a bit intriguing in that there weren’t any generational comparisons, just a “+30%” and “+50%” figure against the competition. I initially theorized to mean +10% and +28% against the A14, so let’s see if that pans out:
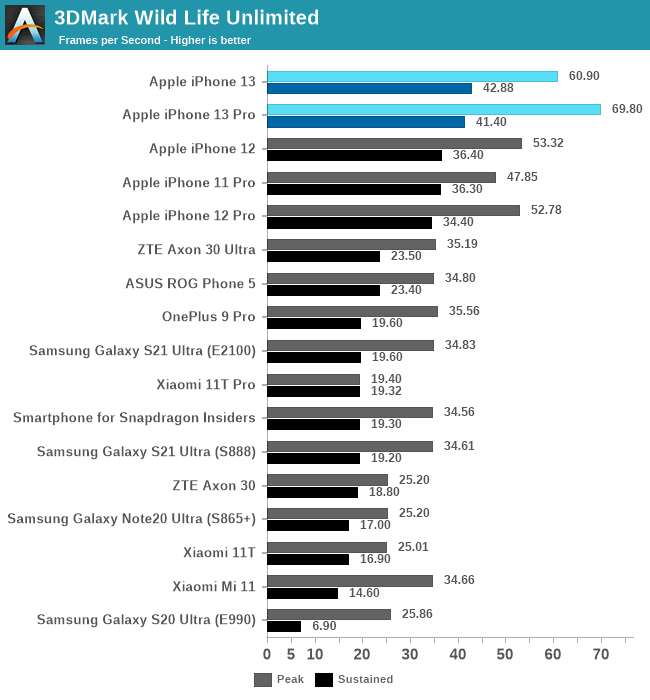
In the 3DMark Wild Life test, we see the 5-core A15 leap the A15 by +30%, while the 4-core showcases a +14% improvement, so quite close to what we predicted. The peak performance here is essentially double that of the nearest competitor, so Apple is likely low-balling things again.
In terms of sustained performance, the new chips continue to showcase a large difference in what they achieve with a cold phone versus a heated phone, interestingly, the 4-core iPhone 13 lands a bit ahead of the 13 Pro here, more on this later.
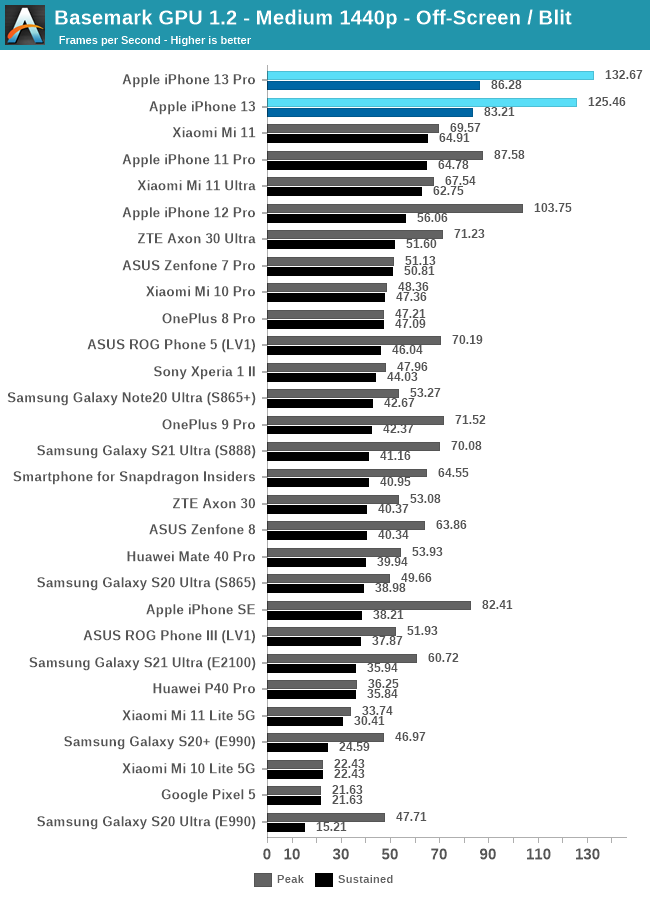
In Basemark GPU, the 13 Pro lands in at +28% over the 12 Pro, with the 4-core iPhone 13 only being slightly slower. Again, the phones throttle hard, however still manage to land with sustained performances well above the peak performances of the competition.
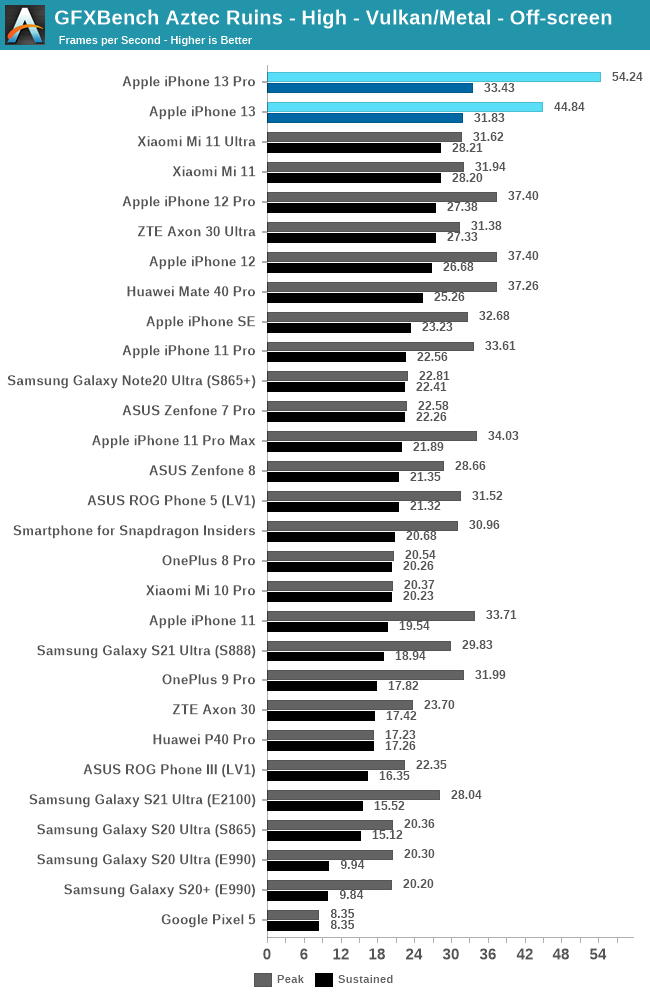
In GFXBench Aztec High, the 13 Pro lands in at a massive +46% performance advantage over the 12 Pro, while the 13 showcases a +19% boost. These are numbers that are above the expectations – in terms of microarchitectural changes the new A15 GPU appears to adopt the same double FP32 throughput as on the M1 GPU, seemingly adding extra units alongside the existing FP32/double-rate FP16 ALUs. The increased 32MB SLC will also likely help a lot with GPU bandwidth and hit-rates, so these two changes seem to be the most obvious explanations for the massive increases.
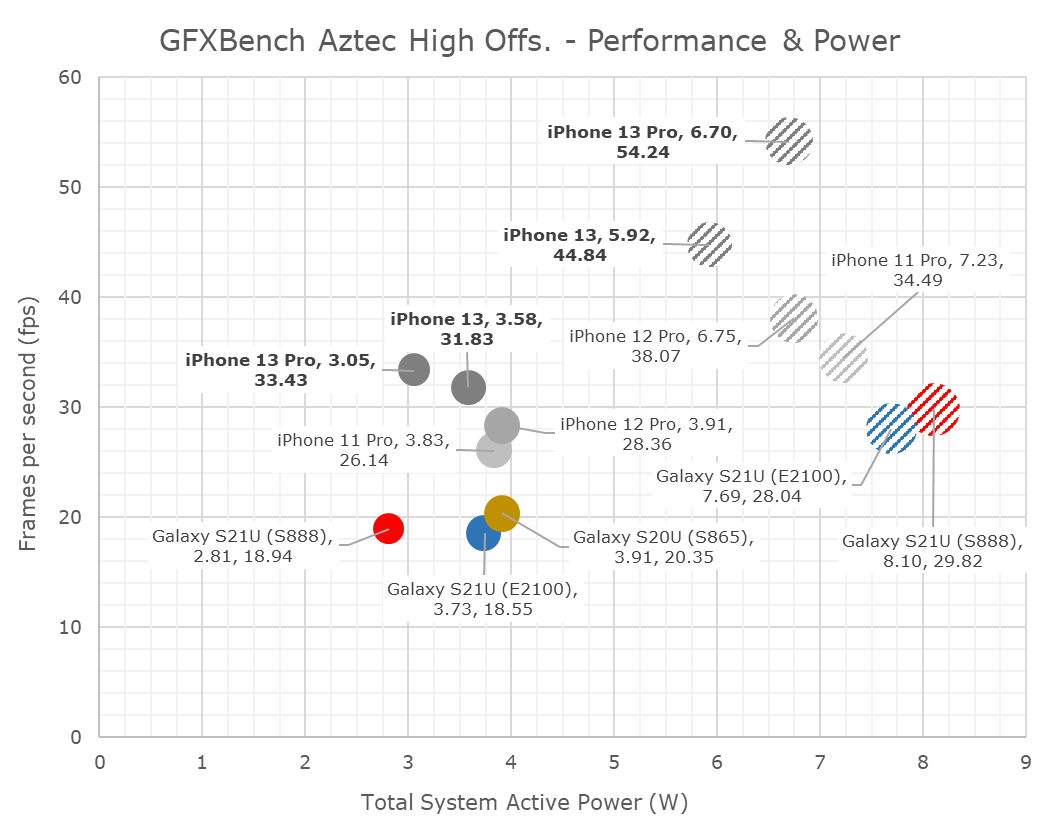
In terms of power and efficiency, I’m also migrating away from tables to bubble charts to better represent the spatial positioning of the various SoCs.
I’d also like to note here that I had went ahead and re-measured the A13 and A14 phones in their peak performance states, showcasing larger power figures than the ones we’ve published in the past. Reason for this is the methodology where we’re only able to measure via input power of the phone, as we cannot dismantle our samples and are lacking PMIC fuelgauge access otherwise. The iPhone 13 figures here are generally hopefully correct as I measured other scenarios up to 9W, however there is still a bit of doubt on whether the phone is drawing from battery or not. The sustained power figures have a higher reliability.
As noted, the A15’s peak performance is massively better, but also appearing that the phone is improving the power draw slightly compared to the A14, meaning we see large efficiency improvements.
Both the 13 and 13 Pro throttle quite quickly after a few minutes of load, but generally at different power points. The 13 Pro with its 5-core GPU throttles down to around 3W, while the 13 goes to around 3.6W.
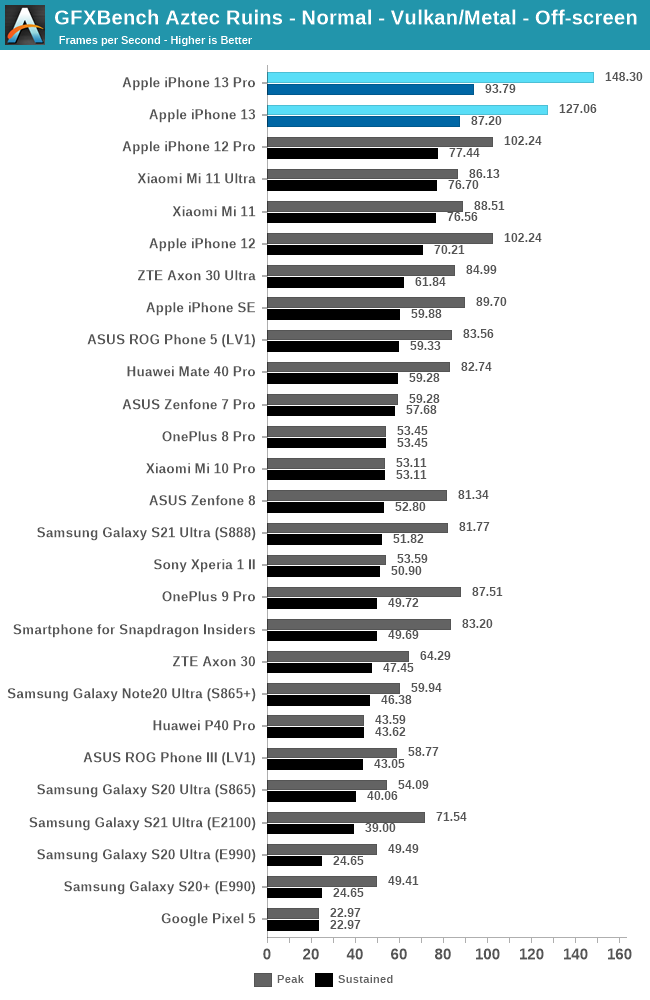
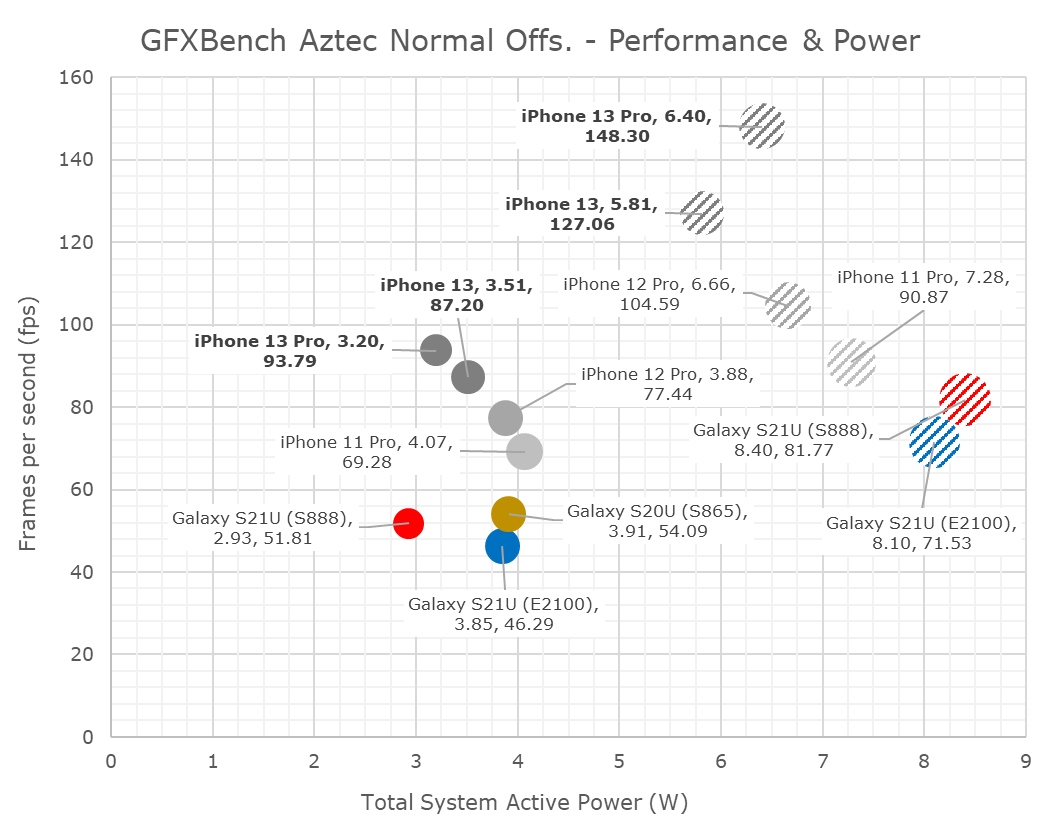
In Aztec Normal, we’re seeing similar relative positioning both in performance and efficiency. The iPhones 13 and 13 Pro are quite closer in performance than expected, due to different throttling levels.
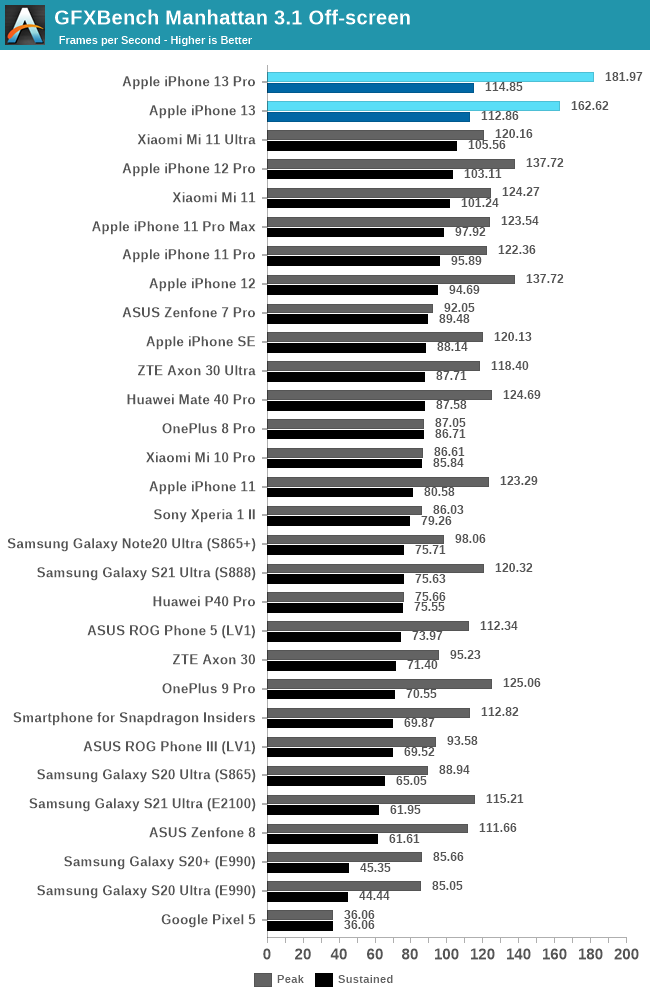
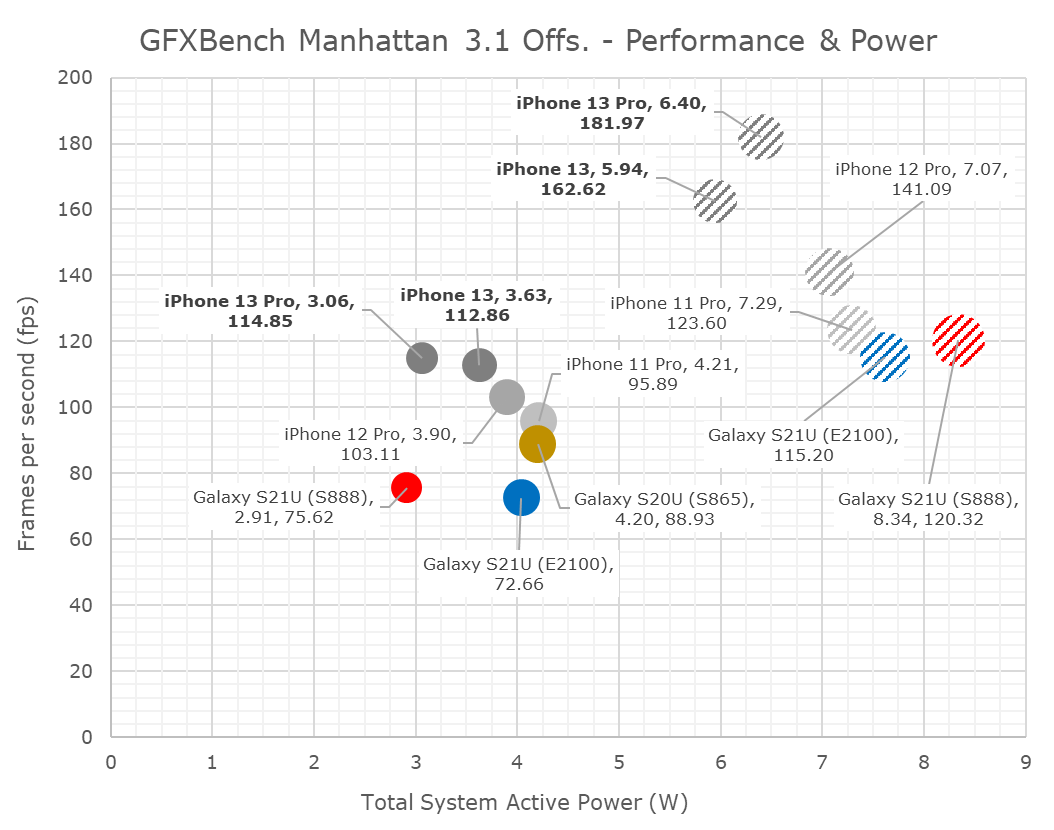
Finally, in Manhattan 3.1, the A15’s 5-core goes up +32%, while the 4-core goes up +18%. The sustained performance isn’t notably different between the two, and also represent smaller improvements over the iPhone 11 and 12 series.
Impressive GPU Performance, but quite limited thermals
Our results here showcase two sides of a coin: In terms of peak performance, the new A15 GPU is absolutely astonishing, and showcasing again improvements that are well above Apple’s marketing claims. The new GPU architecture, and possibly the new SLC allow for fantastic gains in performance, as well as efficiency.
What’s not so great, is the phone’s throttling. Particularly, we seem to be seeing quite reduced power levels on the iPhone 13 Pro, compared to the iPhone 13 as well as previous generation iPhones.
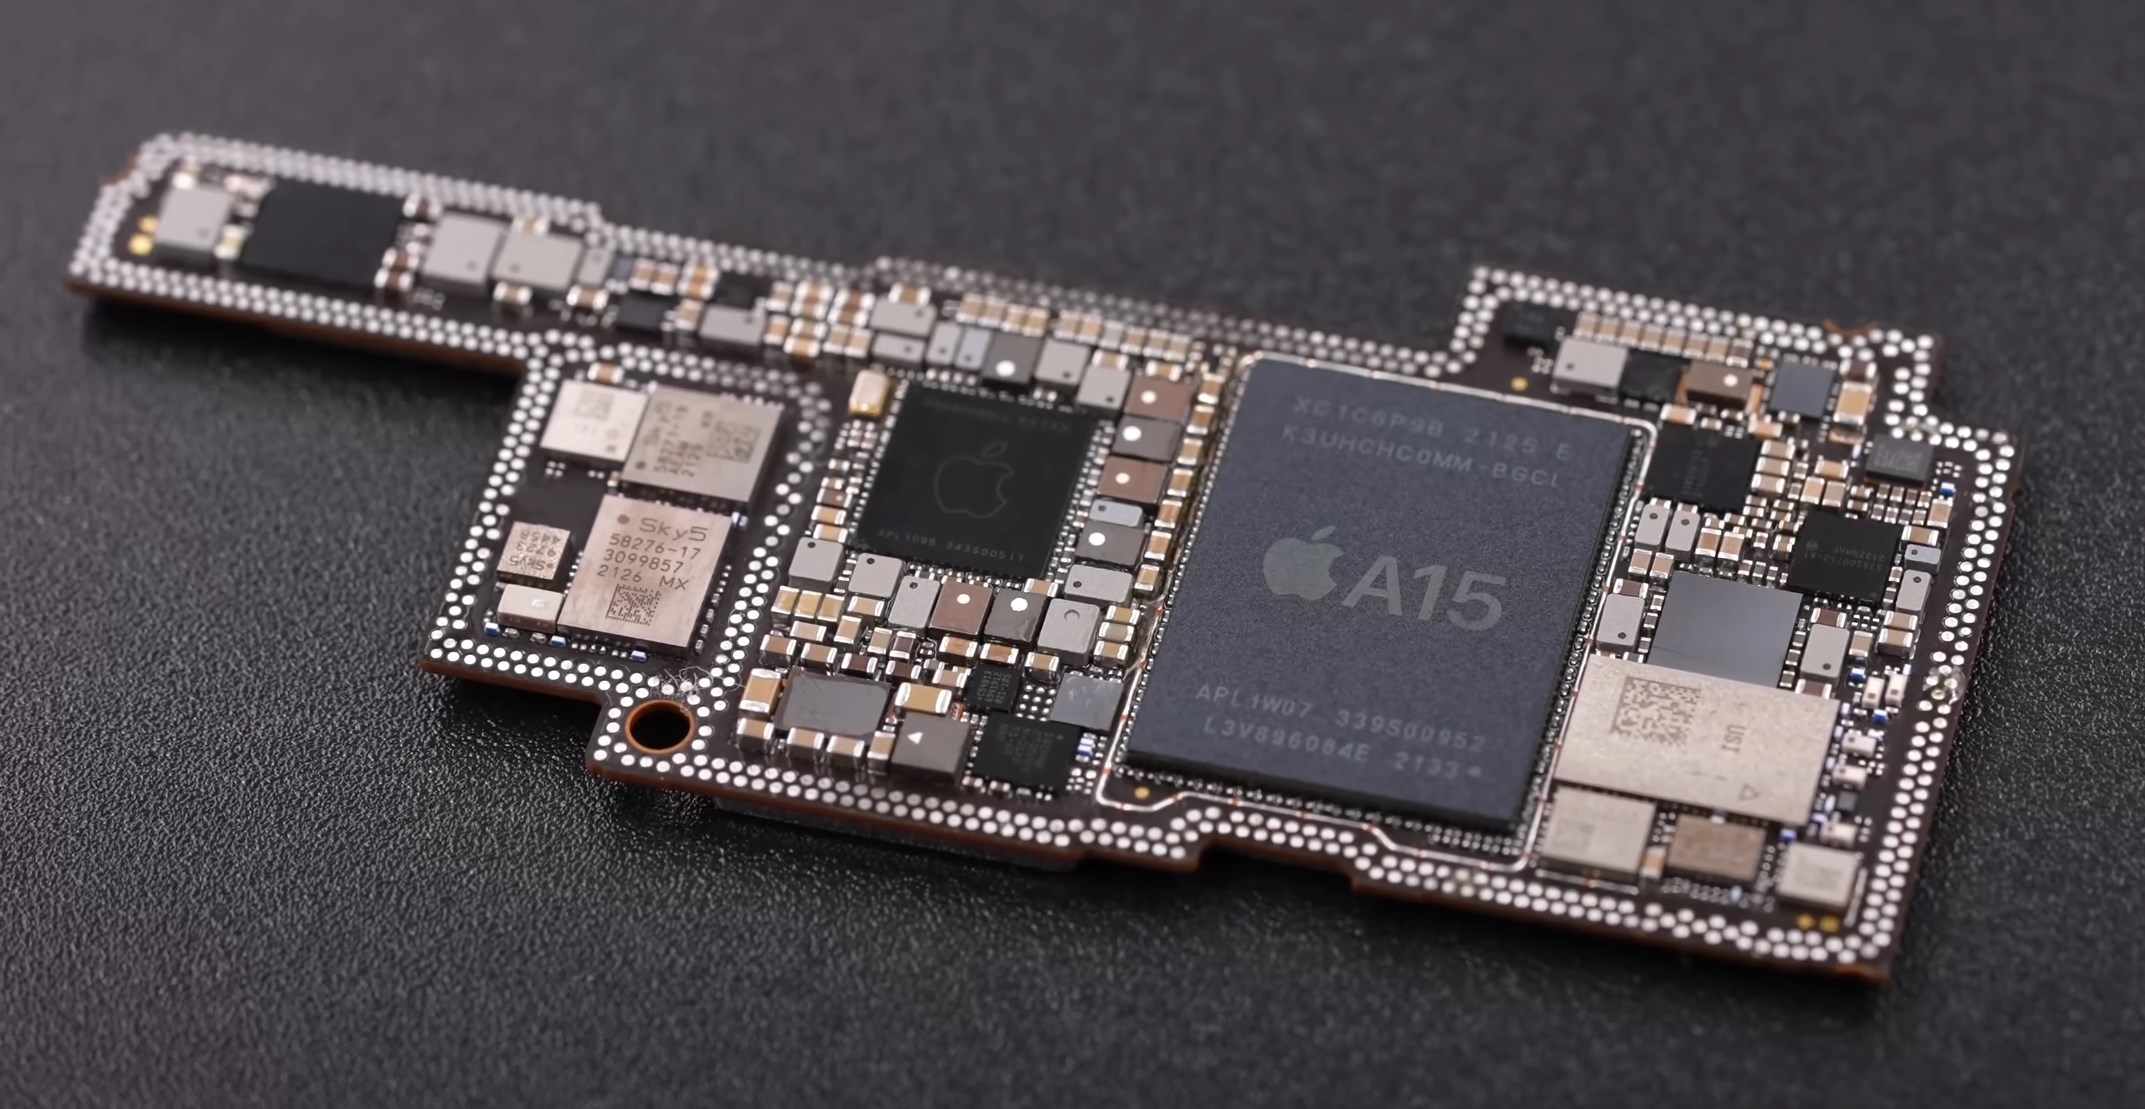
Source: 微机分WekiHome
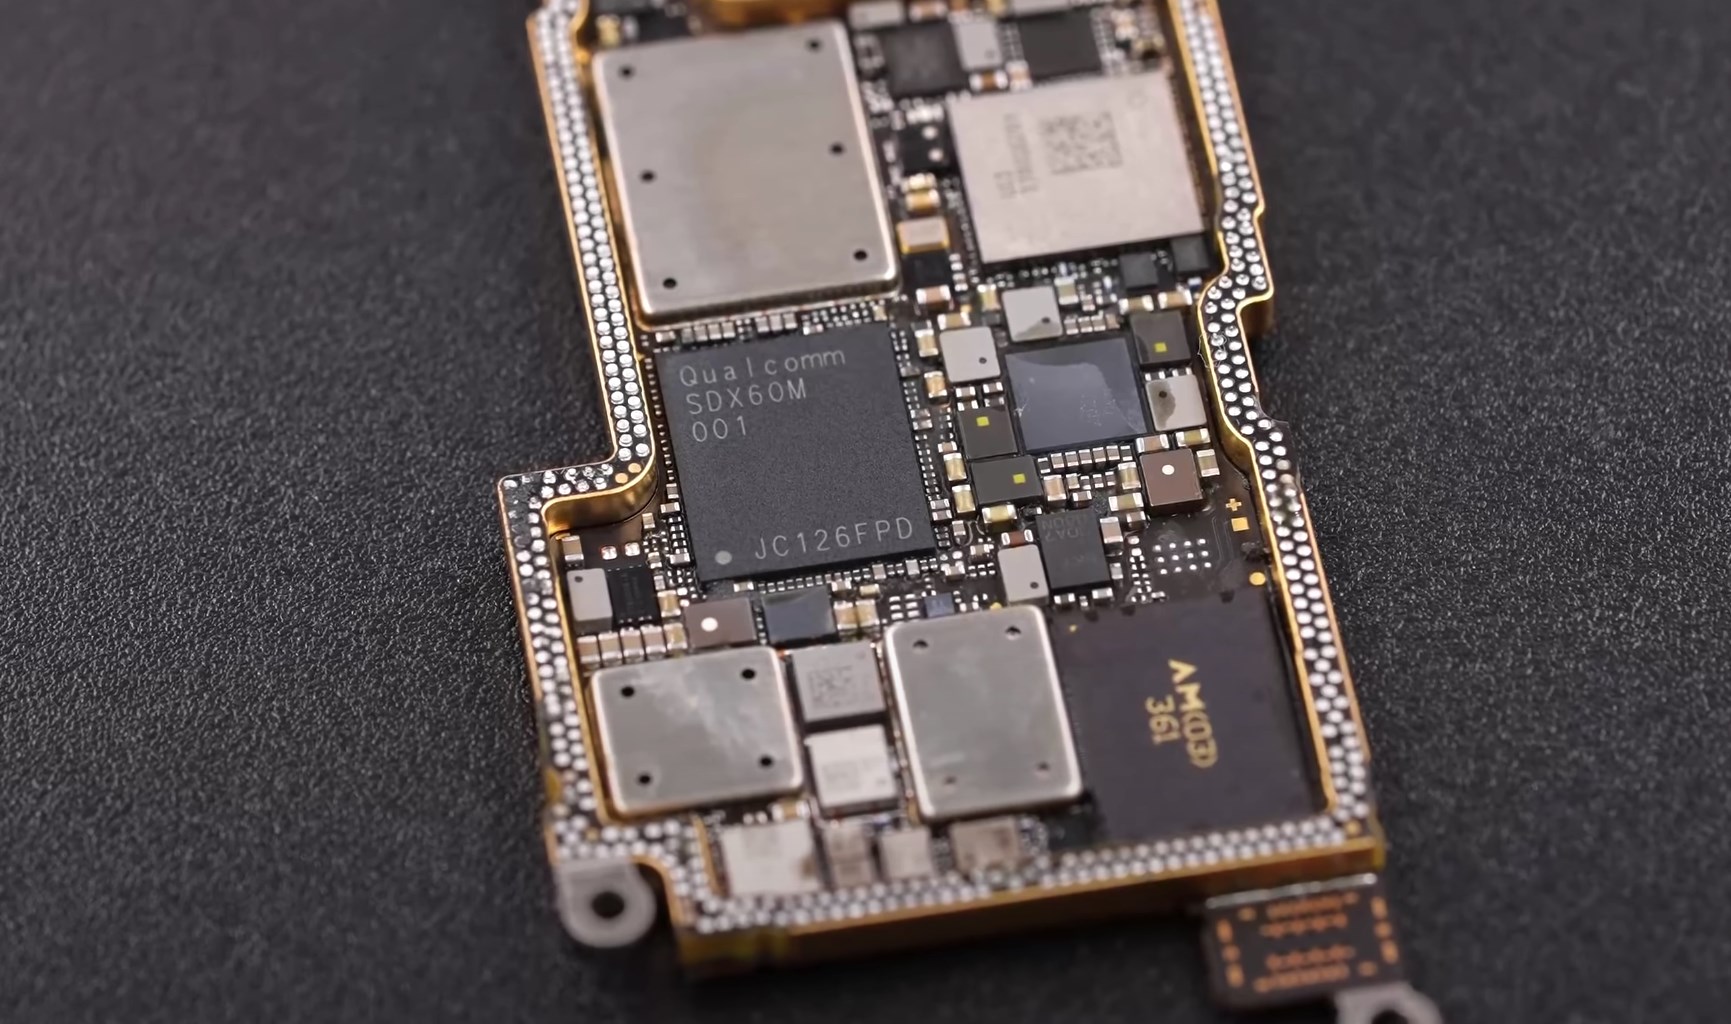
The 13 Pro models this year come with a new PCB design, that’s even denser than what we’ve had on the previous generations, in order to facilitate the larger battery and new camera modules. What’s been extremely perplexing with Apple’s motherboard designs has been the fact that since they employed dual-layer “sandwich” PCBs, is that they’re packaging the SoC on the inside of the two soldered boards. This comes in contrast to other vendors such as Samsung, who also have adopted the “sandwich” PCB, but the SoC is located on the outer side of the assembly, making direct contact with the heat spreader and display mid-frame.
There are reports of the new iPhones throttling more under gaming and cellular connectivity – well, I’m sure that having the modem directly opposite the SoC inside the sandwich is a contributor to this situation. The iPhone 13 Pro showcasing lower sustained power levels may be tied to the new PCB design, and Apple’s overall iPhone thermal design is definitely amongst the worst out there, as it doesn’t do a good job of spreading the heat throughout the body of the phone, achieving a SoC thermal envelope that’s far smaller than the actual device thermal envelope.
No Apples to Apples in Gaming
In terms of general gaming performance, I’ll also want to make note of a few things – the new iPhones, even with their somewhat limited thermal capacity, are still vastly faster than give out a better gaming experience than competitive phones. Lately benchmarking actual games has been something that has risen in popularity, and generally, I’m all for that, however there are just some fundamental inconsistencies that make direct game comparisons not empirically viable to come to SoC conclusions.
Take Genshin Impact for example, unarguably the #1 AAA mobile game out there, and also one of the most performance demanding titles in the market right now, comparing the visual fidelity on a Galaxy S21 Ultra (Snapdragon 888), Mi 11 Ultra, and the iPhone 13 Pro Max:

Galaxy S21 Ultra - Snapdragon 888

Mi 11 Ultra - Snapdragon 888
Even though the S21 Ultra and the Mi 11 Ultra both feature the same SoC, they have very different characteristics in terms of thermals. The S21 Ultra generally sustains about 3.5W total device power under the same conditions, while the Mi 11 Ultra will hover between 5-6W, and a much hotter phone. The difference between the two not only exhibits itself in the performance of the game, but also in the visual fidelity, as the S21 Ultra is running much lower resolution due to the game having a dynamic resolution scaling (both phones had the exact same game settings).

iPhone 13 Pro Max - A15
The comparison between Android phones and iPhones gets even more complicated in that even with the same game setting, the iPhones still have slightly higher resolution, and visual effects that are just outright missing from the Android variant of the game. The visual fidelity of the game is just much higher on Apple’s devices due to the superior shading and features.
In general, this is one reason while I’m apprehensive of publishing real game benchmarks as it’s just a false comparison and can lead to misleading conclusions. We use specifically designed benchmarks to achieve a “ground truth” in terms of performance, especially in the context of SoCs, GPUs, and architectures.
The A15 continues to cement Apple’s dominance in mobile gaming. We’re looking forward to the next-gen competition, especially RDNA-powered Exynos phones next year, but so far it looks like Apple has an extremely comfortable lead to not have to worry much.


204 Comments
View All Comments
unclevagz - Monday, October 4, 2021 - link
Thanks, since Anandtech does have data on Spec 2017 subtests with various x86 processors it may also be helpful to show these results for selected x86 CPUs in the displayed graphs for ease of comparisions.Andrei Frumusanu - Monday, October 4, 2021 - link
I thought about it but didn't want to complicate it too much given the power disparity.Andrei Frumusanu - Monday, October 4, 2021 - link
I added in performance marks for the x86 folks. Obviously no power data.Kangal - Tuesday, October 5, 2021 - link
Hey Andrei,The graphs for Spec-2017 Efficiency looks quiet off. It's showing the Cortex-A55 cores consuming considerable more energy than Apple's E-cores, and sometimes even more than the Cortex-A78 cores too. Whilst performance seems as expected.
The worst offender seems to be the 544.nab_r, with the a discrepancy of 0.60 perf / 682 J = ~0.001 p/J compared to the 2.70 perf / 280 J = ~0.01 p/J. So that's an efficiency difference of ~x10 which is massive. And the best case for the A55 seems to be in the 541.leela_r test. Here we have 1.00 perf / 295 J = ~0.003 p/J compared to the 2.49 perf / 264 J = ~0.009 p/J. So in this best-case scenario the efficiency difference is ~x3 which is still huge.
I mean, I remember when Apple's E-cores were running slightly slower than the Cortex-A73 whilst using slightly more power than the Cortex-A53. But what we have here is just ridiculous. We have even less power draw than the Cortex-A55 or even the Cortex-A53, but performance is somewhere above the legendary Cortex-A76.
I can't wrap my head around it. It feels like an impossibility. Is my maths checking out? Or does there seem to be an issue someplace in the data?
Andrei Frumusanu - Tuesday, October 5, 2021 - link
Perf per joule is a bit of a weird metric that is superfluous, you want either perf/W or simply just Joules consumed for energy efficiency, so either 0.60 / 0.24W = 2.5ppW & 2.7 / 0.45W = 6ppW. You can argue about power curves and ISO-perf or ISO-power.In any case, the other thing to consider is that we're not just measuring the core, we're measuring the efficiency of the whole SoC, power delivery, DRAM as well. Some vendors aren't running things as efficiently as they should be, that's how you end up with those Exynos A55 results, contrasted for example to the MediaTek A55 results.
Kangal - Wednesday, October 6, 2021 - link
I didn't know that, I thought we had the software just churn out how much power the module was using on its own. With that said, I don't think it would be a factor. Apple doesn't have anything special in the makeup of their silicon to make it more efficient than competitors. And even if they did have a notable advantage in the make-up of their silicon, this would be against something like a RockChip SoC, and not against a flagship Qualcomm SoC. The more feasible explanation would be that the QSD chip might be activating other co-processors like it's NPU, and the task isn't actually being hardware-accelerated by it, but "software-encoded" by its targeted CPU (eg A55). Thus its still running slow, but now its wasting power by having other co-processors become active and not actually compute anything......Would something like this be a cause for concern, for future testing?
Secondly, I used the Joules as that's what the graph was visually showing. I basically used it to find the best-case and worst-case scenario. I didn't really think hard about it. Since you've graphed it, and since you've recorded it, I figured you knew something that I didn't and prioritised Joules over Watts.
Converting them to Watts, we instead get:
(nab_r) 2.70/0.45 = 6.00 vs 2.50 = 0.6/0.24 ---> a difference of x2.4
(leela_r) 2.49/0.40 = 6.23 vs 5.56 = 1.00/0.18 ----> a difference of x1.1
But now, the graphs themselves need to be switched. For instance, the New Worst-case scenario is now: 520.omnetpp_r (~x3.4) from what I can see. Maybe I'll go through these benchmark figures properly on a weekend or something, unless you guys plan on doing something of the sort.
So yes, these ranges do seem more reasonable. For starters, here we see the "IceStorm v2" cores are actually using about double the power of the "Cortex-A55" on half of the tests. This shatters my previous impression, that Apple's small cores were faster-than Cortex-A73 and used less-power than Cortex-A53. And that fits much neater into our general understanding about them, comparing small in-order cores, versus medium out-of-order cores.
Can we change how the graphs are displayed from now on? Plot the Watts on the Right/Second x-axis instead of Joules. Or better yet, let's just strip out Joules entirely. I mean the third graph, the Energy-Axis should probably be deleted, and just keep the Power-Axis there instead? No?
Ppietra - Wednesday, October 6, 2021 - link
Kangal,Joules will always be the most correct parameter to assess efficiency, since it is the actual energy expended to do all the work.
Power, on the other hand, can fluctuate through time while doing the work, so the Power value can be very deceiving, firstly because it might not be the actual average power usage, secondly because you need to do another calculation to actually measure efficiency.
Kangal - Wednesday, October 6, 2021 - link
Do you know how they calculated the Watts? And how they calculated the Joules?To me, Watts makes much more sense in this context/comparison. Joules is more "universal" measurement, and it might be useful in a niche, but I feel like it could me mis-used/abused easily when put out of context.
How do we explain the HUGE discrepancy in the measurements between Watts and Joules? There is something else here I am not understanding.
Ppietra - Wednesday, October 6, 2021 - link
For that you need to understand what is Power and what is Energy.If there is one parameter that can be misused to assess efficiency while doing a task it’s Power not Energy. What you don’t seem to account for it’s the Time variable that affects how you can interpret Power.
michael2k - Wednesday, October 6, 2021 - link
I wanted to specifically bring something up:Apple doesn't have anything special in the makeup of their silicon to make it more efficient than competitors.
A14: TSMC 5nm (N5)
A15: TSMC 5nm (N5P)
D1200: TSMC 6nm (N6)
SD888: TSMC 5nm (N5)
Technically Apple is one year ahead of Qualcomm and two or so ahead of MediaTek in terms of process.
Looking at the SPECin2017 Power Axis graph we see on average that the A15 IceStorm v2 consumes 0.44W/2349J to achieve a 2.42 score, which puts them on par with the D1200 A78 with it's 2.57 score, but at far higher power cost of 1.13W/6048J
In other words the A78 and A15 have very similar performance, which makes sense since there are many similarities in terms of number of execution units, width, etc. If you look at the older style charts you can see that the efficiency cores were far closer in performance to the A76 'performance' cores on the Kirin 990:
https://www.anandtech.com/show/14892/the-apple-iph...
https://www.anandtech.com/show/14892/the-apple-iph...
Long story short, there doesn't seem to be any surprises. Apple has a process advantage, uses cores similar to ARM's performance cores for efficiency purposes, and does so by clocking them at 3/4 the speed to dramatically reduce the power draw. The A15e only hits 2.016GHz and the A14e maxed at 1.823GHz, and the A13e at 1.728GHz