ASRock Industrial NUC BOX-1165G7 Mini-PC Review: An Ultra-Compact Tiger Lake Desktop
by Ganesh T S on August 26, 2021 8:15 AM EST- Posted in
- Systems
- Intel
- NUC
- UCFF
- Willow Cove
- ASRock Industrial
- Tiger Lake-U
UL Benchmarks - PCMark and 3DMark
This section deals with a couple of UL Futuremark benchmarks - PCMark 10 and 3DMark. While PCMark evaluates the system as a whole, 3DMark focuses on the graphics capabilities with emphasis on gaming workloads.
PCMark 10
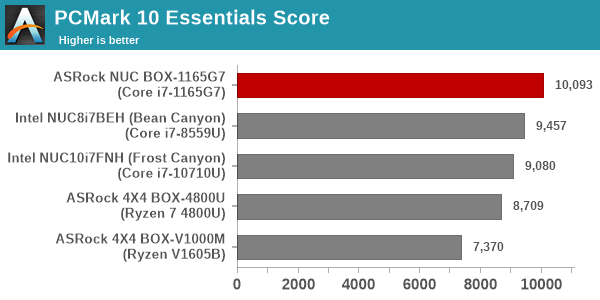
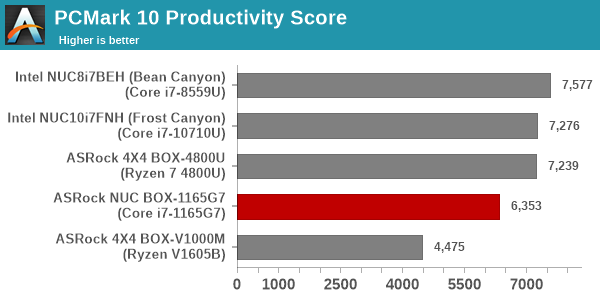
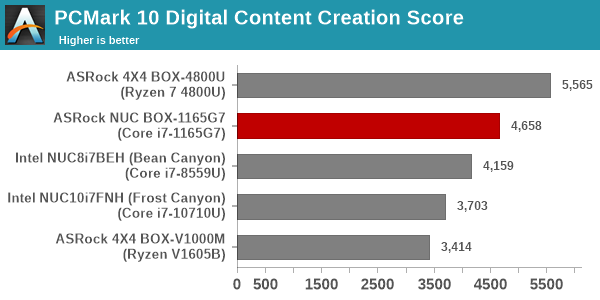
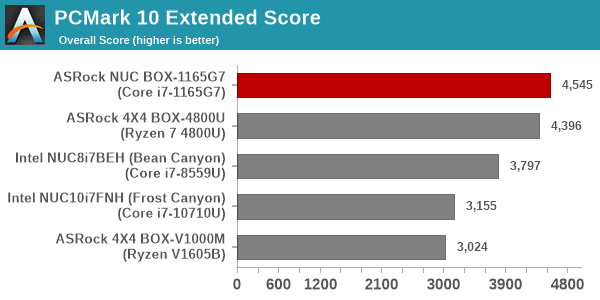
UL's PCMark 10 evaluates computing systems for various usage scenarios (generic / essential tasks such as web browsing and starting up applications, productivity tasks such as editing spreadsheets and documents, gaming, and digital content creation). We benchmarked select PCs with the PCMark 10 Extended profile and recorded the scores for various scenarios. These scores are heavily influenced by the CPU and GPU in the system, though the RAM and storage device also play a part. The power plan was set to Balanced for all the PCs while processing the PCMark 10 benchmark.

3DMark
UL's 3DMark comes with a diverse set of graphics workloads that target different Direct3D feature levels. Correspondingly, the rendering resolutions are also different. We use 3DMark 2.4.4264 to get an idea of the graphics capabilities of the system. In this section, we take a look at the performance of the ASRock NUC BOX-1165G7 across the different 3DMark workloads.
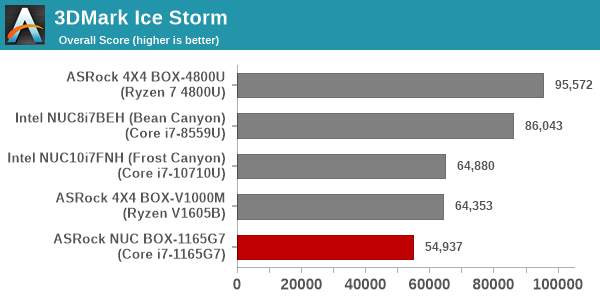
3DMark Ice Storm
This workload has three levels of varying complexity - the vanilla Ice Storm, Ice Storm Unlimited, and Ice Storm Extreme. It is a cross-platform benchmark (which means that the scores can be compared across different tablets and smartphones as well). All three use DirectX 11 (feature level 9) / OpenGL ES 2.0. While the Extreme renders at 1920 x 1080, the other two render at 1280 x 720. The graphs below present the various Ice Storm worloads' numbers for different systems that we have evaluated.
| UL 3DMark - Ice Storm Workloads | |||
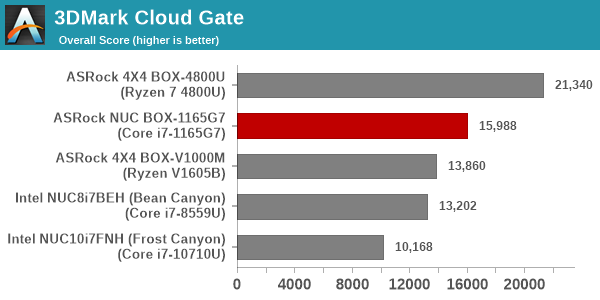
3DMark Cloud Gate
The Cloud Gate workload is meant for notebooks and typical home PCs, and uses DirectX 11 (feature level 10) to render frames at 1280 x 720. The graph below presents the overall score for the workload across all the systems that are being compared.
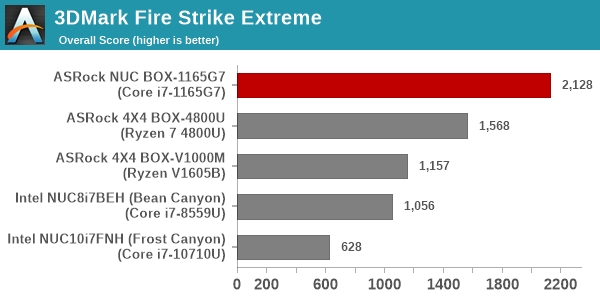
3DMark Fire Strike
The Fire Strike benchmark has three workloads. The base version is meant for high-performance gaming PCs. Similar to Sky Diver, it uses DirectX 11 (feature level 11) to render frames at 1920 x 1080. The Extreme version targets 1440p gaming requirements, while the Ultra version targets 4K gaming system, and renders at 3840 x 2160. The graph below presents the overall score for the Fire Strike Extreme and Fire Strike Ultra benchmark across all the systems that are being compared.
| UL 3DMark - Fire Strike Workloads | |||
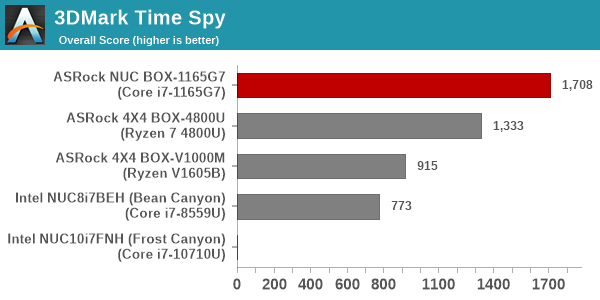
3DMark Time Spy
The Time Spy workload has two levels with different complexities. Both use DirectX 12 (feature level 11). However, the plain version targets high-performance gaming PCs with a 2560 x 1440 render resolution, while the Extreme version renders at 3840 x 2160 resolution. The graphs below present both numbers for all the systems that are being compared in this review.
| UL 3DMark - Time Spy Workloads | |||
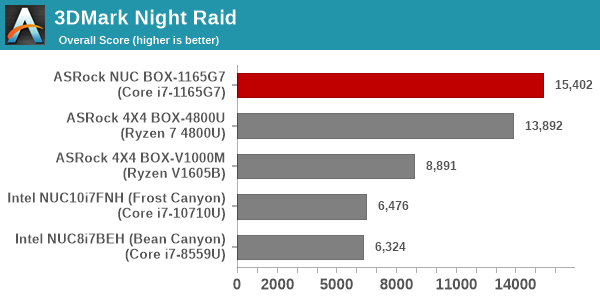
3DMark Night Raid
The Night Raid workload is a DirectX 12 benchmark test. It is less demanding than Time Spy, and is optimized for integrated graphics. The graph below presents the overall score in this workload for different system configurations.
3DMark CPU Profile Benchmark
UL recently introduced a benchmark to test the multi-threaded capabilities of the CPU in a system. Since gaming workloads are often multi-threaded, it makes sense to include this testing as part of the 3DMark suite. The benchmark routine attempts to perform the simulation of birds / bird-like objects flocking together using as many advanced capabilities as offered by the processor. The workload is configured to run with different number of threads ranging from 1 to 16 (and a single entry for the maximum number of threads allowed in the system).
| UL 3DMark - CPU Profile Benchmark | |||
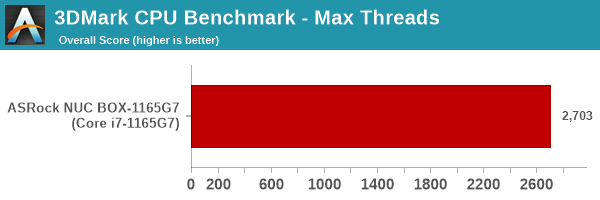
We present the benchmark results for the single and maximum threads case above. Since we have started processing these benchmarks only recently, our sample set for this benchmark is limited. For additional reference, the Beast Canyon NUC with the 65W TDP Tiger Lake processor scored 7117 for the multi-threaded case and 968 for the single-threaded one. Here, we see the 28W TDP version score 2703 and 837 correspondingly.
Overall, we see the NUC BOX-1165G7 perform strongly in most UL workloads where single-threaded performance matters. In the gaming workloads, the results are much more varied, with resolution and details level affecting relative performance greatly.


33 Comments
View All Comments
alpha754293 - Friday, August 27, 2021 - link
It's nice to see some form a NUC that doesn't thermal throttle itself just to keep itself from committing suicide because it has a proper thermal management solution.It would be interesting to see how that fan will fair over time (with accumulation of dust, etc.).
Oxford Guy - Saturday, August 28, 2021 - link
Dual-channel RAM operating at a good speed? 3D TLC NAND?Better than the over $1000 small form factor machine reviewed here recently. It came with a single RAM SO-DIMM and, as far as I recall, QLC.
Psionic Potato - Monday, August 30, 2021 - link
I have had an Asrock Beebox-S Series for an HTPC and will be replacing it soon because it started hard crashing when playing 4K MKVs a few months ago. generating graphical glitches upon rebooting, and generally becoming a PITA. Anything I buy from Gigabyte, Asus, Supermicro, and MSI I've gotten to last for 7+ years, but not Asrock, so I won't be buying their stuff again.I've got my eye on the Minisforum Zen3 mini PC that xsoft7 mentioned. Everyone seems to be raving about it and 8 cores to add to the 16 Zen3 cores my desktop PC has when I'm ripping BluRays? Why not?