The Samsung 870 EVO (1TB & 4TB) Review: Does the World Need Premium SATA SSDs?
by Billy Tallis on February 17, 2021 8:00 AM ESTMixed IO Performance
For details on our mixed IO tests, please see the overview of our 2021 Consumer SSD Benchmark Suite.
 |
|||||||||
| Mixed Random IO | Mixed Sequential IO | ||||||||
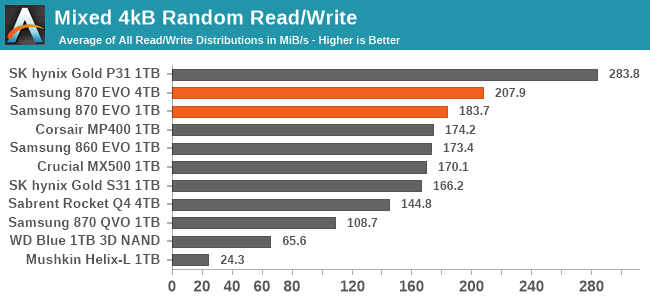
The mixed random IO test provides the Samsung 870 EVO with one of its biggest performance wins yet over the rest of the SATA field and the entry-level NVMe competition. But most of that comes from the capacity advantage the 4TB model has over most of these comparison drives; the 1TB 870 EVO is only about 5% faster overall than the 860 EVO. On the mixed sequential IO test, the SATA bottleneck keeps most of the performance scores within a fairly narrow range, and the 1TB 870 EVO's performance is actually a bit of a regression compared to its predecessor.
 |
|||||||||
| Mixed Random IO | Mixed Sequential IO | ||||||||
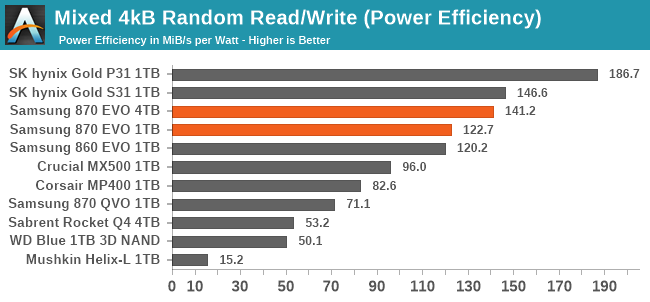
As with our separate tests of random reads and writes, the top efficiency scores for mixed random IO go to SK hynix, with Samsung's TLC drives turning in the next best scores and having a clear advantage over other competing brands. Over on the sequential IO side of things, the efficiency scores more closely mirror the performance scores, and the 870 EVO doesn't have any real advantage over other mainstream SATA drives.
 |
|||||||||
| Mixed Random IO | |||||||||
| Mixed Sequential IO | |||||||||
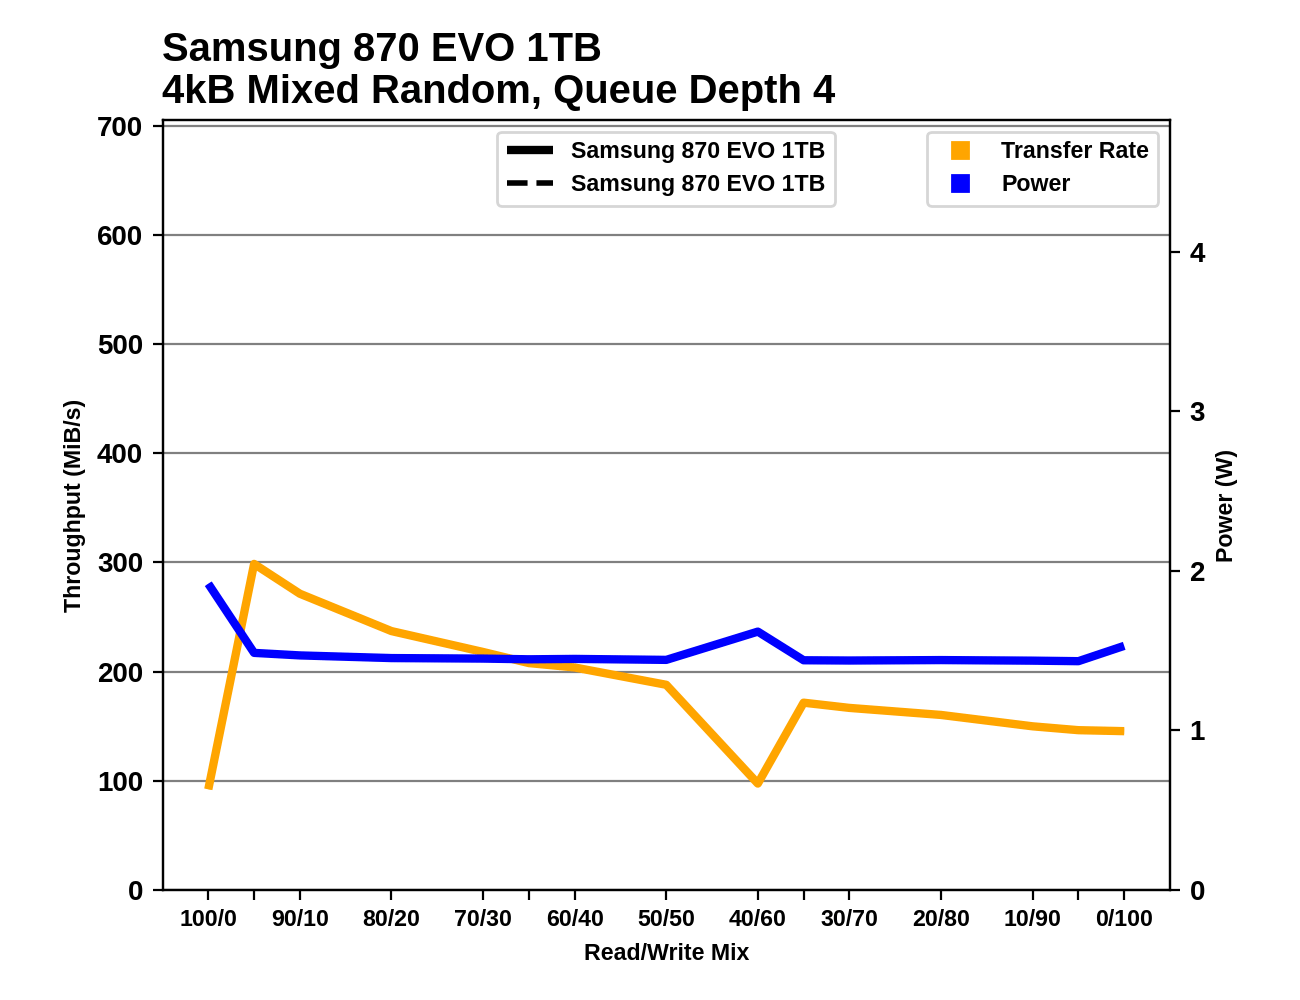
The 1TB 870 EVO's performance during the mixed random IO test is more consistent than the 860 EVO's, but still has a few unpleasant drops that aren't present for the 4TB model. On the mixed sequential IO test, the 1TB 870 EVO's performance is actually a bit less consistent than the 860 EVO. But aside from those occasional outliers, the general trend is for the 870 EVO to provide superior random IO performance and link-saturating sequential performance across a wide range of workload mixes.
Idle Power Management
Real-world client storage workloads leave SSDs idle most of the time, so the active power measurements presented earlier in this review only account for a small part of what determines a drive's suitability for battery-powered use. Especially under light use, the power efficiency of a SSD is determined mostly be how well it can save power when idle.
SATA SSDs are tested with SATA link power management disabled to measure their active idle power draw, and with it enabled for the deeper idle power consumption score and the idle wake-up latency test. Our testbed, like any ordinary desktop system, cannot trigger the deepest DevSleep idle state. For more details, please see the overview of our 2021 Consumer SSD Benchmark Suite.
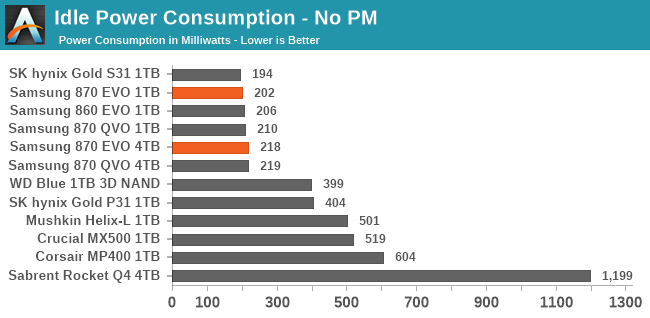
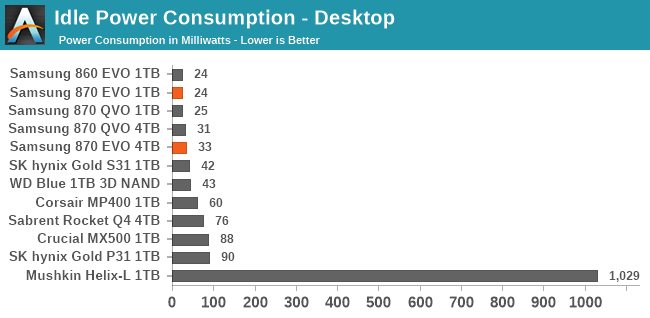
The Samsung 870 EVO may feature an updated controller compared to the 860 EVO, but there's no real difference in idle power consumption, for either active idle or the desktop (non-DevSleep) idle states. Samsung's idle power figures are best in class, with SK hynix offering the only close competition.
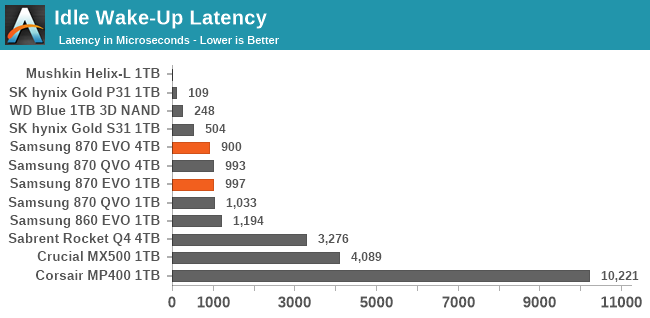
The Samsung SATA drives all take about one millisecond to wake up from using SATA link power management. This is higher than several of the other SATA drives, but not really enough to be of much concern for system responsiveness.


136 Comments
View All Comments
yifu - Thursday, October 27, 2022 - link
Hi anandtech , what is the s2fps05a01 chip. Is it a voltage sensor circuit, or power management ic. I don’t see this kind of chip on other ssds. Seems micron crucial has a chip like that. M.2 especially i can see no other seems to have a extra chip like that. Is it has anything to do with reduce Risk power outages?Ryan Smith - Friday, October 28, 2022 - link
Per a quick check, that would appear to be a PMIC.These aren't typically needed for SSDs. But I don't know quite enough that I'm comfortable in speculating why it's there.