How We Test PCIe 4.0 Storage: The AnandTech 2021 SSD Benchmark Suite
by Billy Tallis on February 1, 2021 1:15 PM ESTAdvanced Synthetic Tests
Our benchmark suite includes a variety of tests that are less about replicating any real-world IO patterns, and more about exposing the inner workings of a drive with narrowly-focused tests. Many of these tests will show exaggerated differences between drives, and for the most part that should not be taken as a sign that one drive will be drastically faster for real-world usage. These tests are about satisfying curiosity, and are not good measures of overall drive performance.
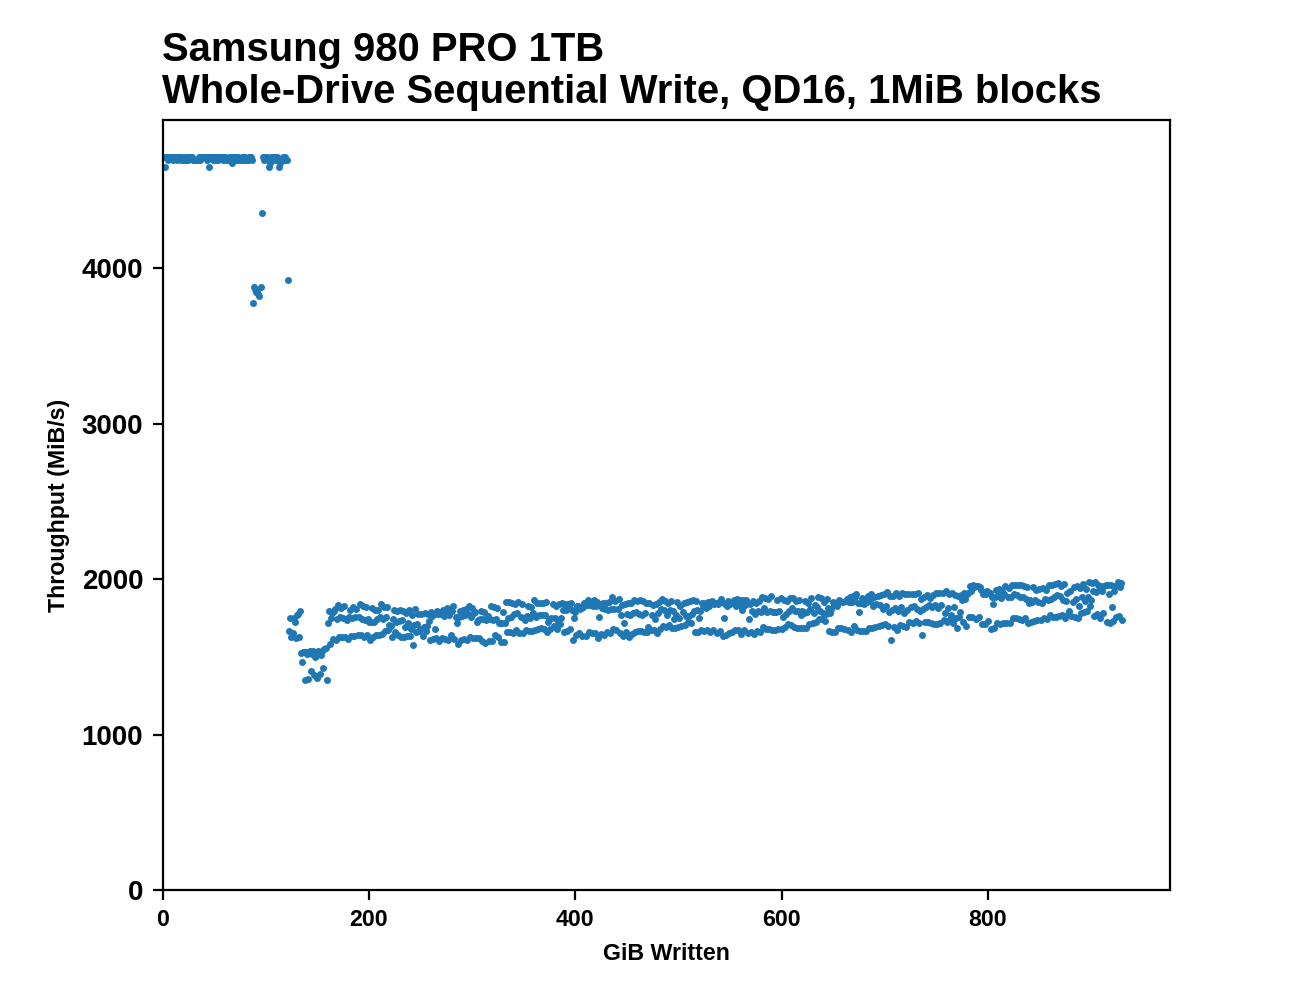
Sequential Drive Fill
The main purpose of the sequential drive fill tests are to estimate the size of a drive's SLC write cache. This test is also one of the most likely to trigger thermal throttling, because it is the longest-running sustained IO test in our suite. This test performs two passes of writing to the drive. The first is conducted after erasing the drive and giving it a few minutes to cool down and finish any background work. This first pass of sequential writes shows us the best-case SLC cache capacity, since any variable-sized cache will be at its largest when starting on an empty drive. The second pass is conducted after giving the drive some idle time and performing some read performance tests. By the time the second write pass begins, the drive should have finished any background work and we should observe the worst-case SLC cache capacity for drives that have a variable size cache.
As the second sequential write pass continues, the SLC cache will eventually be filled and even drives that don't use SLC caching will usually show some performance drop. This is pushing the drive well beyond the limits of any real-world consumer workload, so aside from any SLC cache at the beginning, performance during the second pass is irrelevant. However, since this second pass is overwriting data that was also written sequentially, the drive's garbage collection during this process is quite straightforward. Overwriting the drive with random writes instead of sequential writes would be more likely to fill the drive's spare area and induce more severe performance drops.
 |
|||||||||
| Pass 1 | |||||||||
| Pass 2 | |||||||||
 |
|||||||||
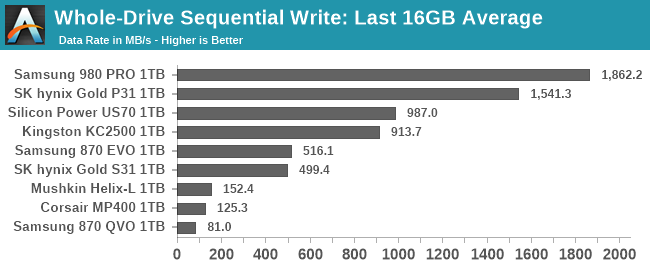
| Average Throughput for last 16 GB | Overall Average Throughput | ||||||||
After both passes of sequential writes are complete, the last 20% of the drive is TRIMed and the drive is given plenty of idle time. This prepares the drive for the battery of tests that are conducted on an 80%-full drive—full enough that SLC cache size is significantly reduced, but still leaving some empty space to avoid testing the absolute worst-case scenario of performance on a completely full drive.
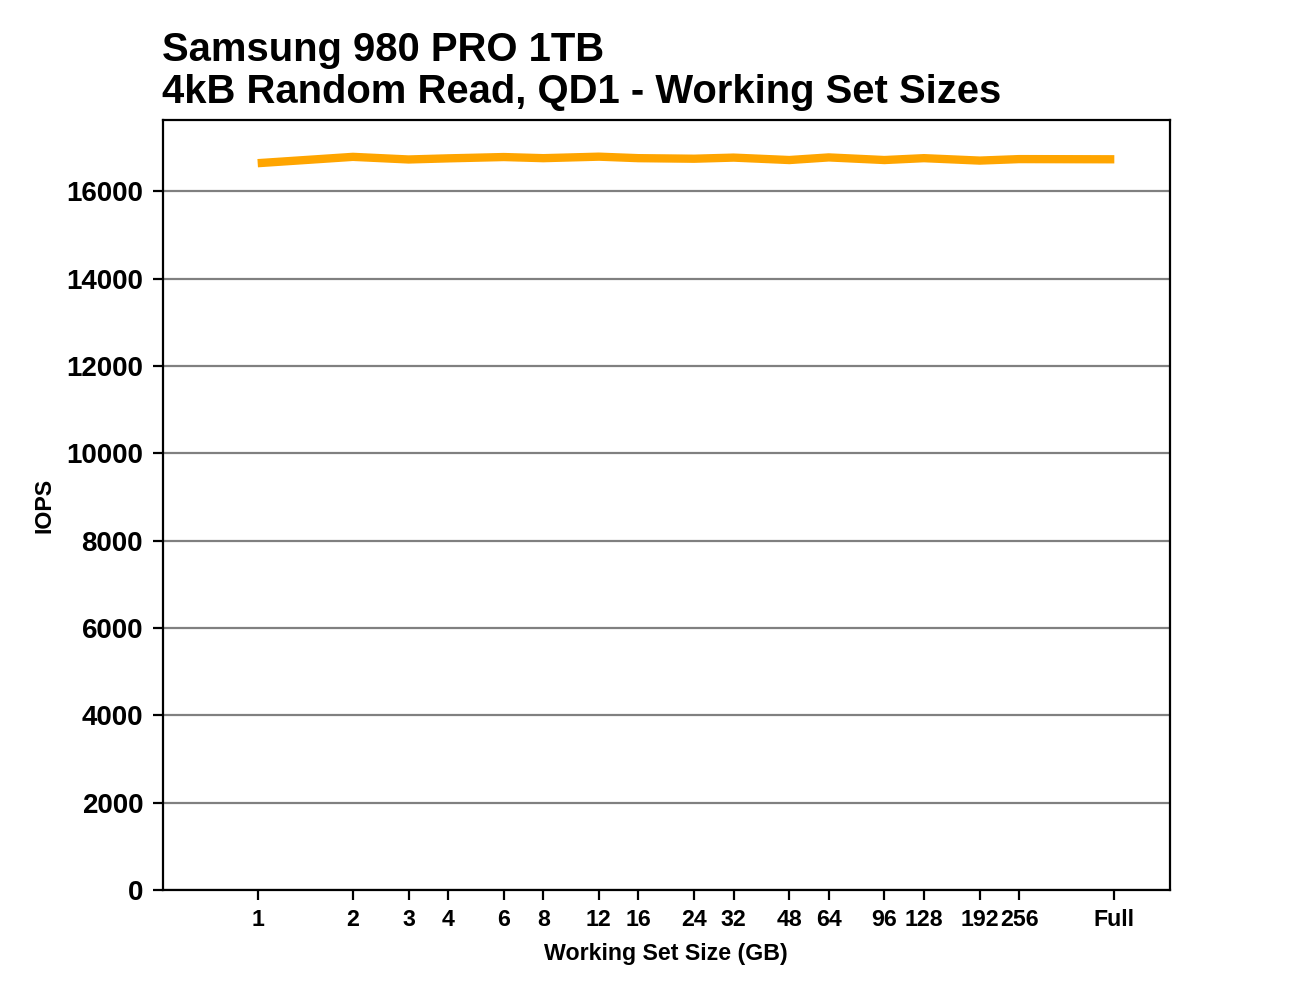
Working Set Size
This test performs random 4kB reads at queue depth 1 while varying the working set size: the size of the dataset that the random reads are coming from. When the working set size is small, the access pattern has a high degree of spatial locality, and DRAMless drives should have no trouble caching the limited amount of NAND mapping information needed to handle the reads. As the working set size increases, drives with little or no RAM are likely to show reduced performance from an increasing number of FTL cache misses. Often there is a sharp drop in performance that suggests the size of any on-controller SRAM or HMB cache in use. Drives with some DRAM but not the full 1GB per 1TB ratio may be able to handle very large working set sizes with good performance, but typically still show reduced performance when random reads span the entire drive.
 |
|||||||||
This test also provides an opportunity to verify that the TRIM command is working properly: when attempting to read data from a portion of the drive that is empty (or has been trimmed), the drive should return a bunch of zeros as soon as it has looked up the relevant LBAs in the FTL and determined that there isn't actually any real flash memory currently allocated to those addresses. So in addition to running the working set size test on a full drive, we also run it when the drive is 32GB full and 80% full, expecting to see substantially increased performance when many or most of the reads should be handled without actually touching the NAND flash memory. These extra test runs aren't included in the graphs we publish, but we're keeping an eye out for drives that don't behave as expected.
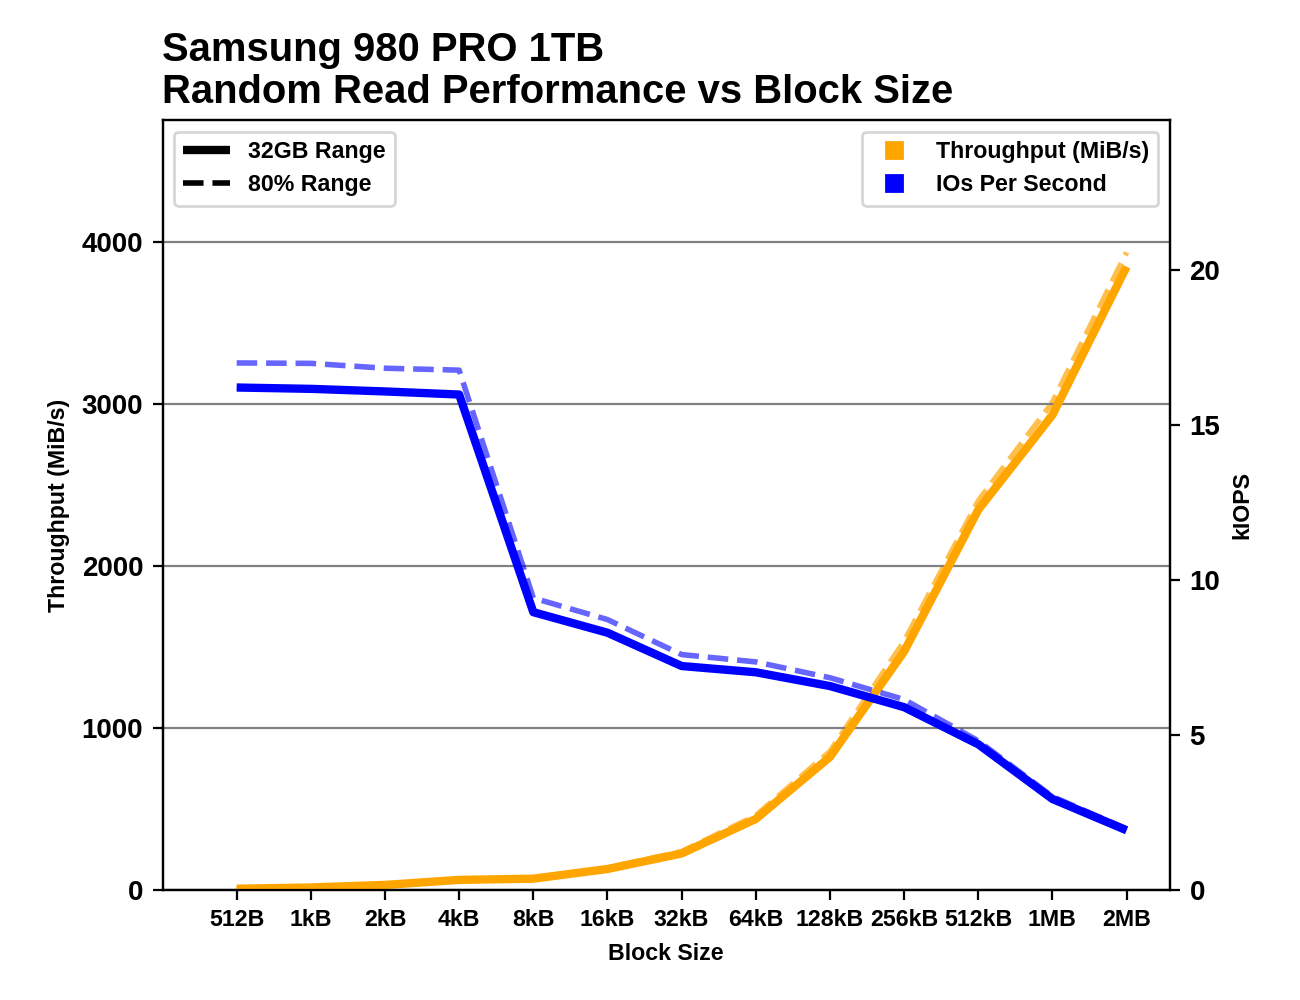
Performance vs Block Size
Industry standard practice is to measure random IO performance using 4kB operations and sequential IO performance using 128kB operations. But SSDs permit IOs as small as 512 bytes, and real-world workloads include a wide variety of actual IO block sizes. Our trace-based tests subject drives to IOs of various sizes, but are ill-suited for analyzing how specific block sizes perform.
These tests perform 1GB of IO at each block size, at a queue depth of 1 and with the usual idle time after each step. Like our other synthetic tests, they're performed both with the drive 32GB full and 80% full, to capture any differences due to things like SLC caching. Regular readers may recognize these tests as based on ones we use as part of our enterprise SSD test suite. The principle is the same, but the configuration here has been adjusted to match the rest of our synthetic tests, and we're now testing up to block sizes of 2MB. As with some of the other tests, the fact that we're testing under Linux means that IOs larger than 128kB get split up by the OS and issued to the drive as a batch. For example, IO with a 1MB block size ends up looking to the drive like eight operations of 128kB issued at the same time.
 |
|||||||||
| Random Read | |||||||||
| Random Write | |||||||||
| Sequential Read | |||||||||
| Sequential Write | |||||||||
There are several interesting phenomena to keep an eye out for. With block sizes smaller than 4kB, we generally see performance that is roughly the same IOPS as with a 4kB block size. This is a consequence of the fact that virtually all flash-based SSDs manage the NAND flash memory in 4kB chunks, even when configured to expose a 512-byte LBA size. Some drives exhibit pathologically low performance with sub-4kB block sizes, especially for writes, where a read-modify-write cycle may be necessary for the drive to preserve the data in the rest of the 4kB block.
Sequential IO with small to medium block sizes can also reveal some surprises, such as drives that seem to assume any 4kB access will be a random access and choose not to read and cache the rest of the (typically ~16kB) NAND page. Quite a few drives also show little improvement in sequential throughput with the medium block sizes, but show significant throughput scaling once the block size is well past 128kB. This is part of why we changed our burst sequential IO tests to use 1MB block sizes instead of 128kB.


70 Comments
View All Comments
IanCutress - Tuesday, February 2, 2021 - link
Some people see sequential reads at QD128 as the 'holy' unified metric ;)Samuel Vimes - Monday, February 1, 2021 - link
Great to see this updated test suite.Would love to see popular SSDs like Corsair MX500, BX500 and Samsung 970 EVO Plus incorporated as reference points.
Also, a note to put numbers in perspective (e.g., "in this test, a 10% difference is/isn't significant")—like in sound measurements where we know +10 dB is twice the perceived sound and we have dB(A), in SSD measurements what amount of difference matters in different scenarii (data loaders, gamers, office use...)?
oRAirwolf - Monday, February 1, 2021 - link
Very nice. Also nice to see some additional validation of the SK Hynix Gold P31 results. My only complaint with that SSD, which I installed in my XPS 17 9700, is that it does not support hardware encryption with bitlocker. There is definitely a significant performance penalty when testing performance in Crystal Disk Mark with software encryption enabled and disabled. Sad times.svan1971 - Monday, February 1, 2021 - link
where is the fastest 4.0 M.2 ? The Sabrent Rocket 4 Plus ?Beaver M. - Monday, February 1, 2021 - link
Deleting critical comments now, are we?Ryan Smith - Tuesday, February 2, 2021 - link
No comments have been deleted. I only delete them in the most egregious of circumstances, and never for being critical.Deicidium369 - Tuesday, February 2, 2021 - link
Thank, I needed a good laugh - I guess contradicting Ian Cutress is egregious - not in this article - but the badly botched Xe HPC write up.Slippery slope leading to Tom's Hardware level of protecting the fee fees of "editors".
Martin84a - Sunday, February 7, 2021 - link
Well one of your writers certainly do. I pointed out that it's incorrect to write 2TB, 2MB, 2MHz, 2mm etc. and that it's incorrect to write 2Mb when you mean 2 MB (megabyte), and that I was surprised to see such a lack of consistency on Anandtech. *Deleted*.Martin84a - Sunday, February 7, 2021 - link
For those not getting it, the ISO standard, IEC and writing it as a proper SI unit all specify that the numerical value always precedes the unit, and that is always used to separate the unit from the number.Martin84a - Tuesday, February 9, 2021 - link
*a space is always used.