AMD Zen 3 Ryzen Deep Dive Review: 5950X, 5900X, 5800X and 5600X Tested
by Dr. Ian Cutress on November 5, 2020 9:01 AM ESTCPU Tests: Simulation
Simulation and Science have a lot of overlap in the benchmarking world, however for this distinction we’re separating into two segments mostly based on the utility of the resulting data. The benchmarks that fall under Science have a distinct use for the data they output – in our Simulation section, these act more like synthetics but at some level are still trying to simulate a given environment.
DigiCortex v1.35: link
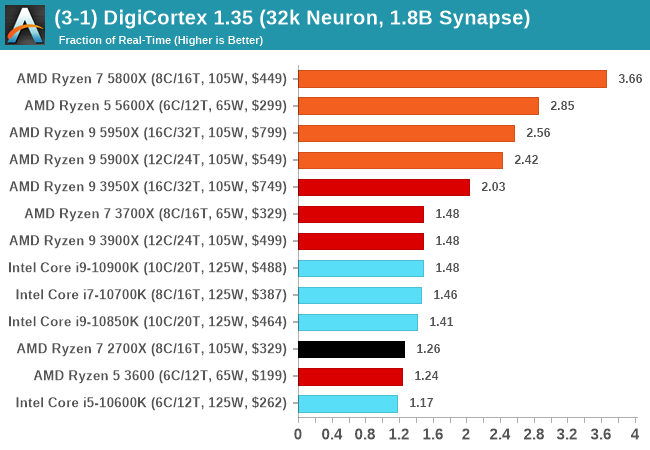
DigiCortex is a pet project for the visualization of neuron and synapse activity in the brain. The software comes with a variety of benchmark modes, and we take the small benchmark which runs a 32k neuron/1.8B synapse simulation, similar to a small slug.
The results on the output are given as a fraction of whether the system can simulate in real-time, so anything above a value of one is suitable for real-time work. The benchmark offers a 'no firing synapse' mode, which in essence detects DRAM and bus speed, however we take the firing mode which adds CPU work with every firing.

The software originally shipped with a benchmark that recorded the first few cycles and output a result. So while fast multi-threaded processors this made the benchmark last less than a few seconds, slow dual-core processors could be running for almost an hour. There is also the issue of DigiCortex starting with a base neuron/synapse map in ‘off mode’, giving a high result in the first few cycles as none of the nodes are currently active. We found that the performance settles down into a steady state after a while (when the model is actively in use), so we asked the author to allow for a ‘warm-up’ phase and for the benchmark to be the average over a second sample time.
For our test, we give the benchmark 20000 cycles to warm up and then take the data over the next 10000 cycles seconds for the test – on a modern processor this takes 30 seconds and 150 seconds respectively. This is then repeated a minimum of 10 times, with the first three results rejected. Results are shown as a multiple of real-time calculation.
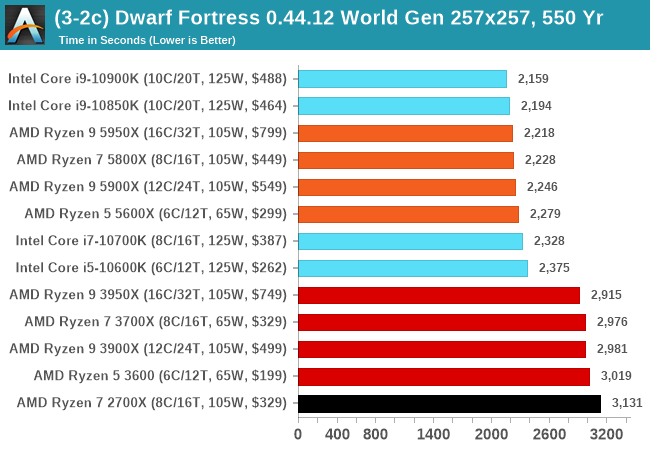
Dwarf Fortress 0.44.12: Link
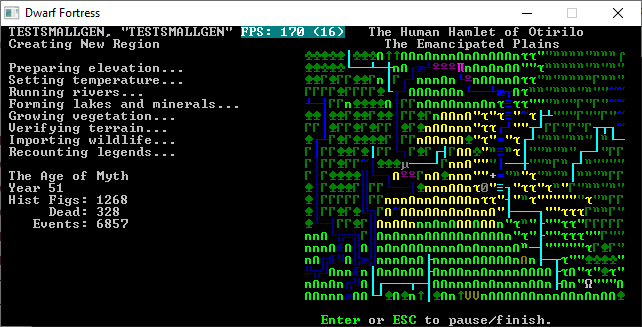
Another long standing request for our benchmark suite has been Dwarf Fortress, a popular management/roguelike indie video game, first launched in 2006 and still being regularly updated today, aiming for a Steam launch sometime in the future.
Emulating the ASCII interfaces of old, this title is a rather complex beast, which can generate environments subject to millennia of rule, famous faces, peasants, and key historical figures and events. The further you get into the game, depending on the size of the world, the slower it becomes as it has to simulate more famous people, more world events, and the natural way that humanoid creatures take over an environment. Like some kind of virus.
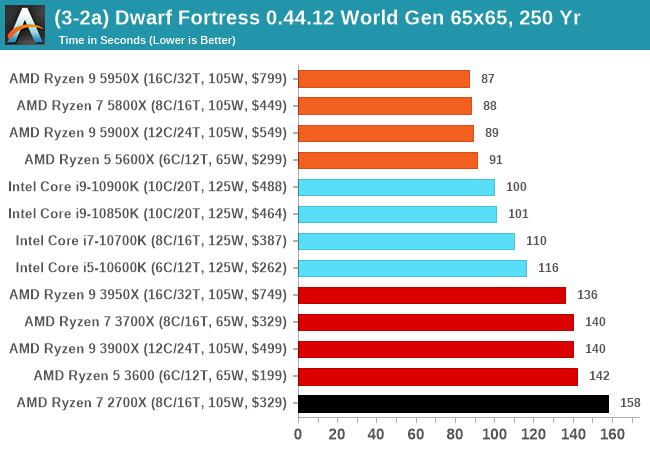
For our test we’re using DFMark. DFMark is a benchmark built by vorsgren on the Bay12Forums that gives two different modes built on DFHack: world generation and embark. These tests can be configured, but range anywhere from 3 minutes to several hours. After analyzing the test, we ended up going for three different world generation sizes:
- Small, a 65x65 world with 250 years, 10 civilizations and 4 megabeasts
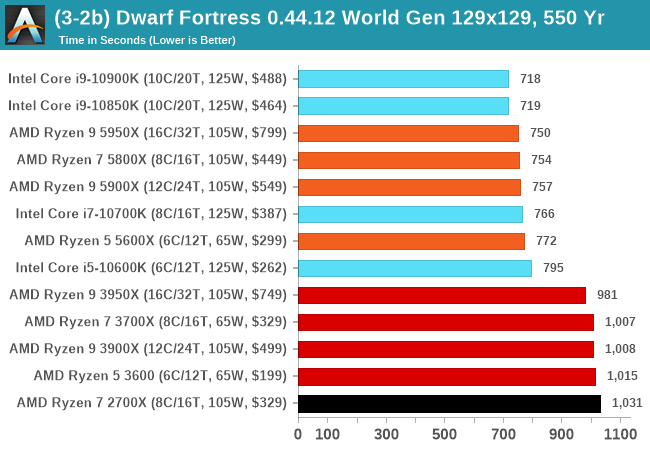
- Medium, a 127x127 world with 550 years, 10 civilizations and 4 megabeasts
- Large, a 257x257 world with 550 years, 40 civilizations and 10 megabeasts
DFMark outputs the time to run any given test, so this is what we use for the output. We loop the small test for as many times possible in 10 minutes, the medium test for as many times in 30 minutes, and the large test for as many times in an hour.
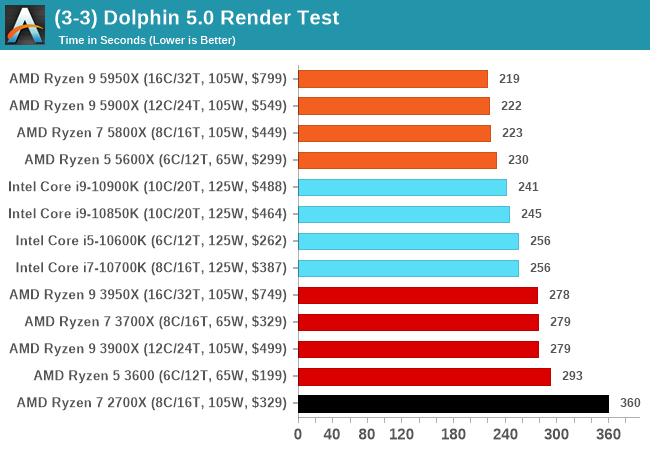
Dolphin v5.0 Emulation: Link
Many emulators are often bound by single thread CPU performance, and general reports tended to suggest that Haswell provided a significant boost to emulator performance. This benchmark runs a Wii program that ray traces a complex 3D scene inside the Dolphin Wii emulator. Performance on this benchmark is a good proxy of the speed of Dolphin CPU emulation, which is an intensive single core task using most aspects of a CPU. Results are given in seconds, where the Wii itself scores 1051 seconds.


339 Comments
View All Comments
TheinsanegamerN - Tuesday, November 10, 2020 - link
However AMD's boost algorithim is very temperature sensitive. Those coolers may work fine, but if they get to the 70C range you're losing max performance to higher temperatures.Andrew LB - Sunday, December 13, 2020 - link
Blah blah....Ryzen 5800x @ 3.6-4.7ghz : 219w and 82'c.
Ryzen 5800x @ 4.7ghz locked: 231w and 88'c.
Fractal Celsius+ S28 Prisma 280mm AIO CPU cooler at full fan and pump speed
https://www.kitguru.net/components/cpu/luke-hill/a...
If you actually set your voltages on Intel chips they stay cool. My i7-10700k @ 5.0ghz all-core locked never goes above 70'c.
Count Rushmore - Friday, November 6, 2020 - link
It took 3 days... finally the article load-up.AT seriously need to upgrade their server (or I need to stop using IE6).
name99 - Friday, November 6, 2020 - link
"AMD wouldn’t exactly detail what this means but we suspect that this could allude to now two branch predictions per cycle instead of just one"So imagine you have wide OoO CPU. How do you design fetch? The current state of the art (and presumably AMD have aspects of this, though perhaps not the *entire* package) goes as follows:
Instructions come as runs of sequential instructions separated by branches. At a branch you may HAVE to fetch instructions from a new address (think call, goto, return) or you may perhaps continue to the next address (think non-taken branch).
So an intermediate complexity fetch engine will bring in blobs of instructions, up to (say 6 or 8) with the run of instructions terminating at
- I've scooped up N or
- I've hit a branch or
- I've hit the end of a cache line.
Basically every cycle should consist of pulling in the longest run of instructions possible subject to the above rules.
The way really advanced fetch works is totally decoupled from the rest of the CPU. Every cycle the fetch engine predicts the next fetch address (from some hierarchy of : check the link stack, check the BTB, increment the PC), and fetches as much as possible from that address. These are stuck in a queue connected to decode, and ideally that queue would never run dry.
BUT: on average there is about a branch every 6 instructions.
Now supposed you want to sustain, let's say, 8-wide. That means that you might set N at 8, but most of the time you'll fetch 6 or so instructions because you'll bail out based on hitting a branch before you have a full 8 instructions in your scoop. So you're mostly unable to go beyond an IPC of 6, even if *everything* else is ideal.
BUT most branches are conditional. And good enough half of those are not taken. This means that if you can generate TWO branch predictions per cycle then much of the time the first branch will not be taken, can be ignored, and fetch can continue in a straight line past it. Big win! Half the time you can pull in only 6 instructions, but the other half you could pull in maybe 12 instructions. Basically, if you want to sustain 8 wide, you'd probably want to pull in at least 10 or 12 instructions under best case conditions, to help fill up the queue for the cases where you pull in less than 8 instructions (first branch is taken, or you reach the end of the cache line).
Now there are some technicalities here.
One is "how does fetch know where the branches are, to know when to stop fetching". This is usually done via pre-decode bits living in the I-cache, and set by a kinda decode when the line is first pulled into the I-cache. (I think x86 also does this, but I have no idea how. It's obviously much easier for a sane ISA like ARM, POWER, even z.)
Second, and more interesting, is that you're actually performing two DIFFERENT TYPES of prediction, which makes it somewhat easier from a bandwidth point of view. The prediction on the first branch is purely "taken/not taken", and all you care about is "not taken"; the prediction on the second branch is more sophisticated because if you predict taken you also have to predict the target, which means dealing BTB or link stack.
But you don't have to predict TWO DIFFERENT "next fetch addresses" per cycle, which makes it somewhat easier.
Note also that any CPU that uses two level branch prediction is, I think, already doing two branch prediction per cycle, even if it doesn't look like it. Think about it: how do you USE a large (but slow) second level pool of branch prediction information?
You run the async fetch engine primarily from the first level; and this gives a constant stream of "runs of instructions, separated by branches" with zero delay cycles between runs. Great, zero cycle branches, we all want that. BUT for the predictors to generate a new result in a single cycle they can't be too large.
So you also run a separate engine, delayed a cycle or two, based on the larger pool of second level branch data, checking the predictions of the async engine. If there's a disagreement you flush whatever was fetched past that point (which hopefully is still just in the fetch queue...) and resteer. This will give you a one (or three or four) cycle bubble in the fetch stream, which is not ideal, but
- it doesn't happen that often
- it's a lot better catching a bad prediction very early in fetch, rather than much later in execution
- hopefully the fetch queue is full enough, and filled fast enough, that perhaps it's not even drained by the time decode has walked along it to the point at which the re-steer occurred...
This second (checking) branch prediction doesn't ever get mentioned, but it is there behind the scenes, even when the CPU is ostensibly doing only a single prediction per cycle.
There are other crazy things that happen in modern fetch engines (which are basically in themselves as complicated as a whole CPU from 20 years ago).
One interesting idea is to use the same data that is informing the async fetch engine to inform prefetch. The idea is that you now have essentially two fetch engines running. One is as I described above; the second ONLY cares about the stream of TAKEN branches, and follows that stream as rapidly as possible, ensuring that each line referenced by this stream is being pulled into the I-cache. (You will recognize this as something like a very specialized form of run-ahead.)
In principle this should be perfect -- the I prefetcher and branch-prediction are both trying to solve the *exact* same problem, so pooling their resources should be optimal! In practice, so far this hasn't yet been perfected; the best simulations using this idea are a very few percent behind the best simulations using a different I prefetch technology. But IMHO this is mostly a consequence of this being a fairly new idea that has so far been explored mainly by using pre-existing branch predictors, rather than designing a branch predictor store that's optimal for both tasks.
The main difference is that what matters for prefetching is "far future" branches, branches somewhat beyond where I am now, so that there's plenty of time to pull in the line all the way from RAM. And existing branch predictors have had no incentive to hold onto that sort of far future prediction state. HOWEVER
A second interesting idea is what IBM has been doing for two or three years now. They store branch prediction in what they call an L2 storage but, to avoid things, I'll cal a cold cache. This is stale/far future branch prediction data that is unused for a while but, on triggering events, that cold cache data will be swapped into the branch prediction storage so that the branch predictors are ready to go for the new context in which they find themselves.
I don't believe IBM use this to drive their I-prefetcher, but obviously it is a great solution to the problem I described above and I suspect this will be where all the performance CPUs eventually find themselves over the next few years. (Apple and IBM probably first, because Apple is Apple, and IBM has the hard part of the solution already in place; then ARM because they's smart and trying hard; then AMD because they're also smart but their technology cycles are slower than ARM; and final Intel because, well, they're Intel and have been running on fumes for a few years now.)
(Note of course this only solves I-prefetch, which is nice and important; but D-prefetch remains as a difficult and different problem.)
name99 - Friday, November 6, 2020 - link
Oh, one more thing. I referred to "width" of the CPU above. This becomes an ever vaguer term every year. The basic points are two:- when OoO started, it seemed reasonable to scale every step of the pipeline together. Make the CPU 4-wide. So it can fetch up to 4 instructions/cycle. decode up to 4, issue up to 4, retire up to 4. BUT if you do this you're losing performance every step of the way. Every cycle that fetches only 3 instructions can never make that up; likewise every cycle that only issues 3 instructions.
- so once you have enough transistors available for better designs, you need to ask yourself what's the RATE-LIMITING step? For x86 that's probably in fetch and decode, but let's consider sane ISAs like ARM. There the rate limiting step is probably register rename. So lets assume your max rename bandwidth is 6 instructions/cycle. You actually want to run the rest of your machinery at something like 7 or 8 wide because (by definition) you CAN do so (they are not rate limiting, so they can be grown). And by running them wider you can ensure that the inevitable hiccups along the way are mostly hidden by queues, and your rename machinery is running at full speed, 6-wide each and every cycle, rather than frequently running at 5 or 4 wide because of some unfortunate glitch upstream.
Spunjji - Monday, November 9, 2020 - link
These were interesting posts. Thank you!GeoffreyA - Monday, November 9, 2020 - link
Yes, excellent posts. Thanks.Touching on width, I was expecting Zen 3 to add another decoder and take it up to 5-wide decode (like Skylake onwards). Zen 3's keeping it at 4 makes good sense though, considering their constraint of not raising power. Another decoder might have raised IPC but would have likely picked up power quite a bit.
ignizkrizalid - Saturday, November 7, 2020 - link
Rip Intel no matter how hard you try squeezing Intel sometimes on top within your graphics! stupid site bias and unreliable if this site was to be truth why not do a live video comparison side by side using 3600 or 4000Mhz ram so we can see the actual numbers and be 100% assured the graphic table is not manipulated in any way, yea I know you will never do it! personally I don't trust these "reviews" that can be manipulated as desired, I respect live video comparison with nothing to hide to the public. Rip Intel Rip Intel.Spunjji - Monday, November 9, 2020 - link
I... don't think this makes an awful lots of sense, tbh.MDD1963 - Saturday, November 7, 2020 - link
It would be interesting to also see the various results of the 10900K the way most people actually run them on Z490 boards, i.e, with higher RAM clocks, MCE enabled, etc...; do the equivalent tuning with 5000 series, I'm sure they will run with faster than DDR4-3200 MHz. plus perhaps a small all-core overclock.